Diagrams
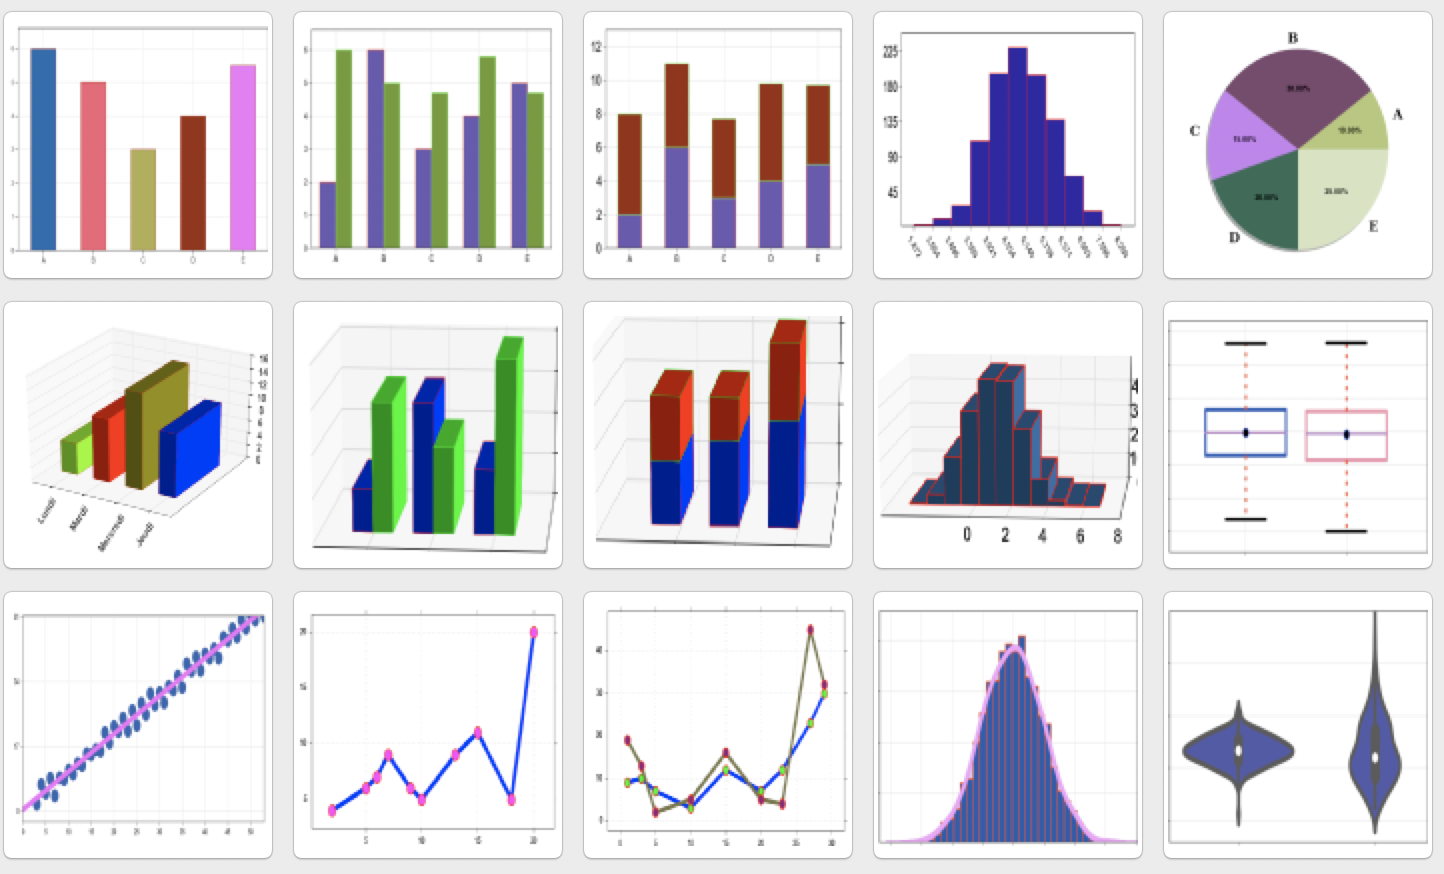
To draw a diagram, first choose the type of diagram: there are 15 of them.
Bar charts
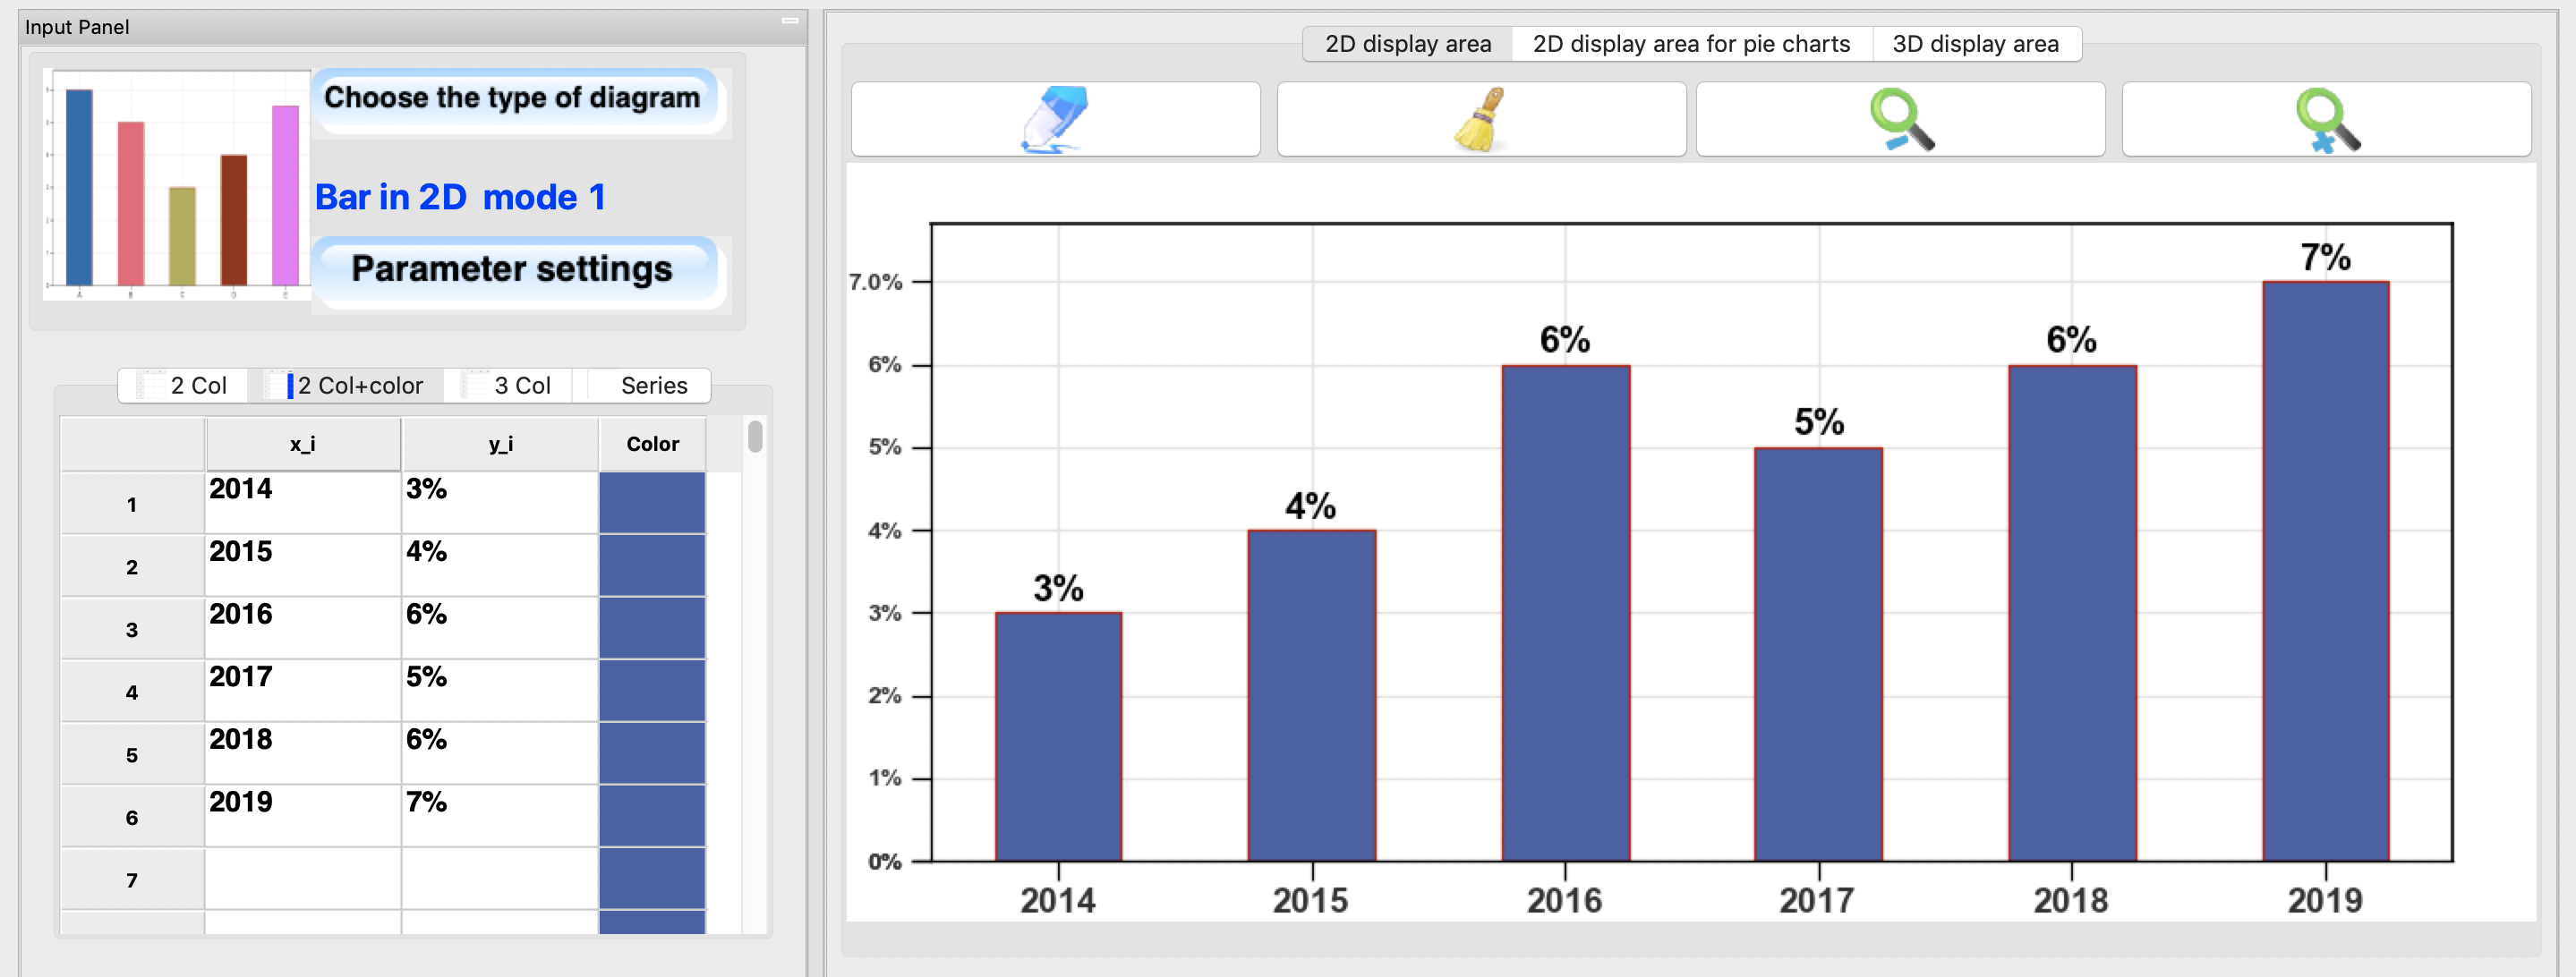
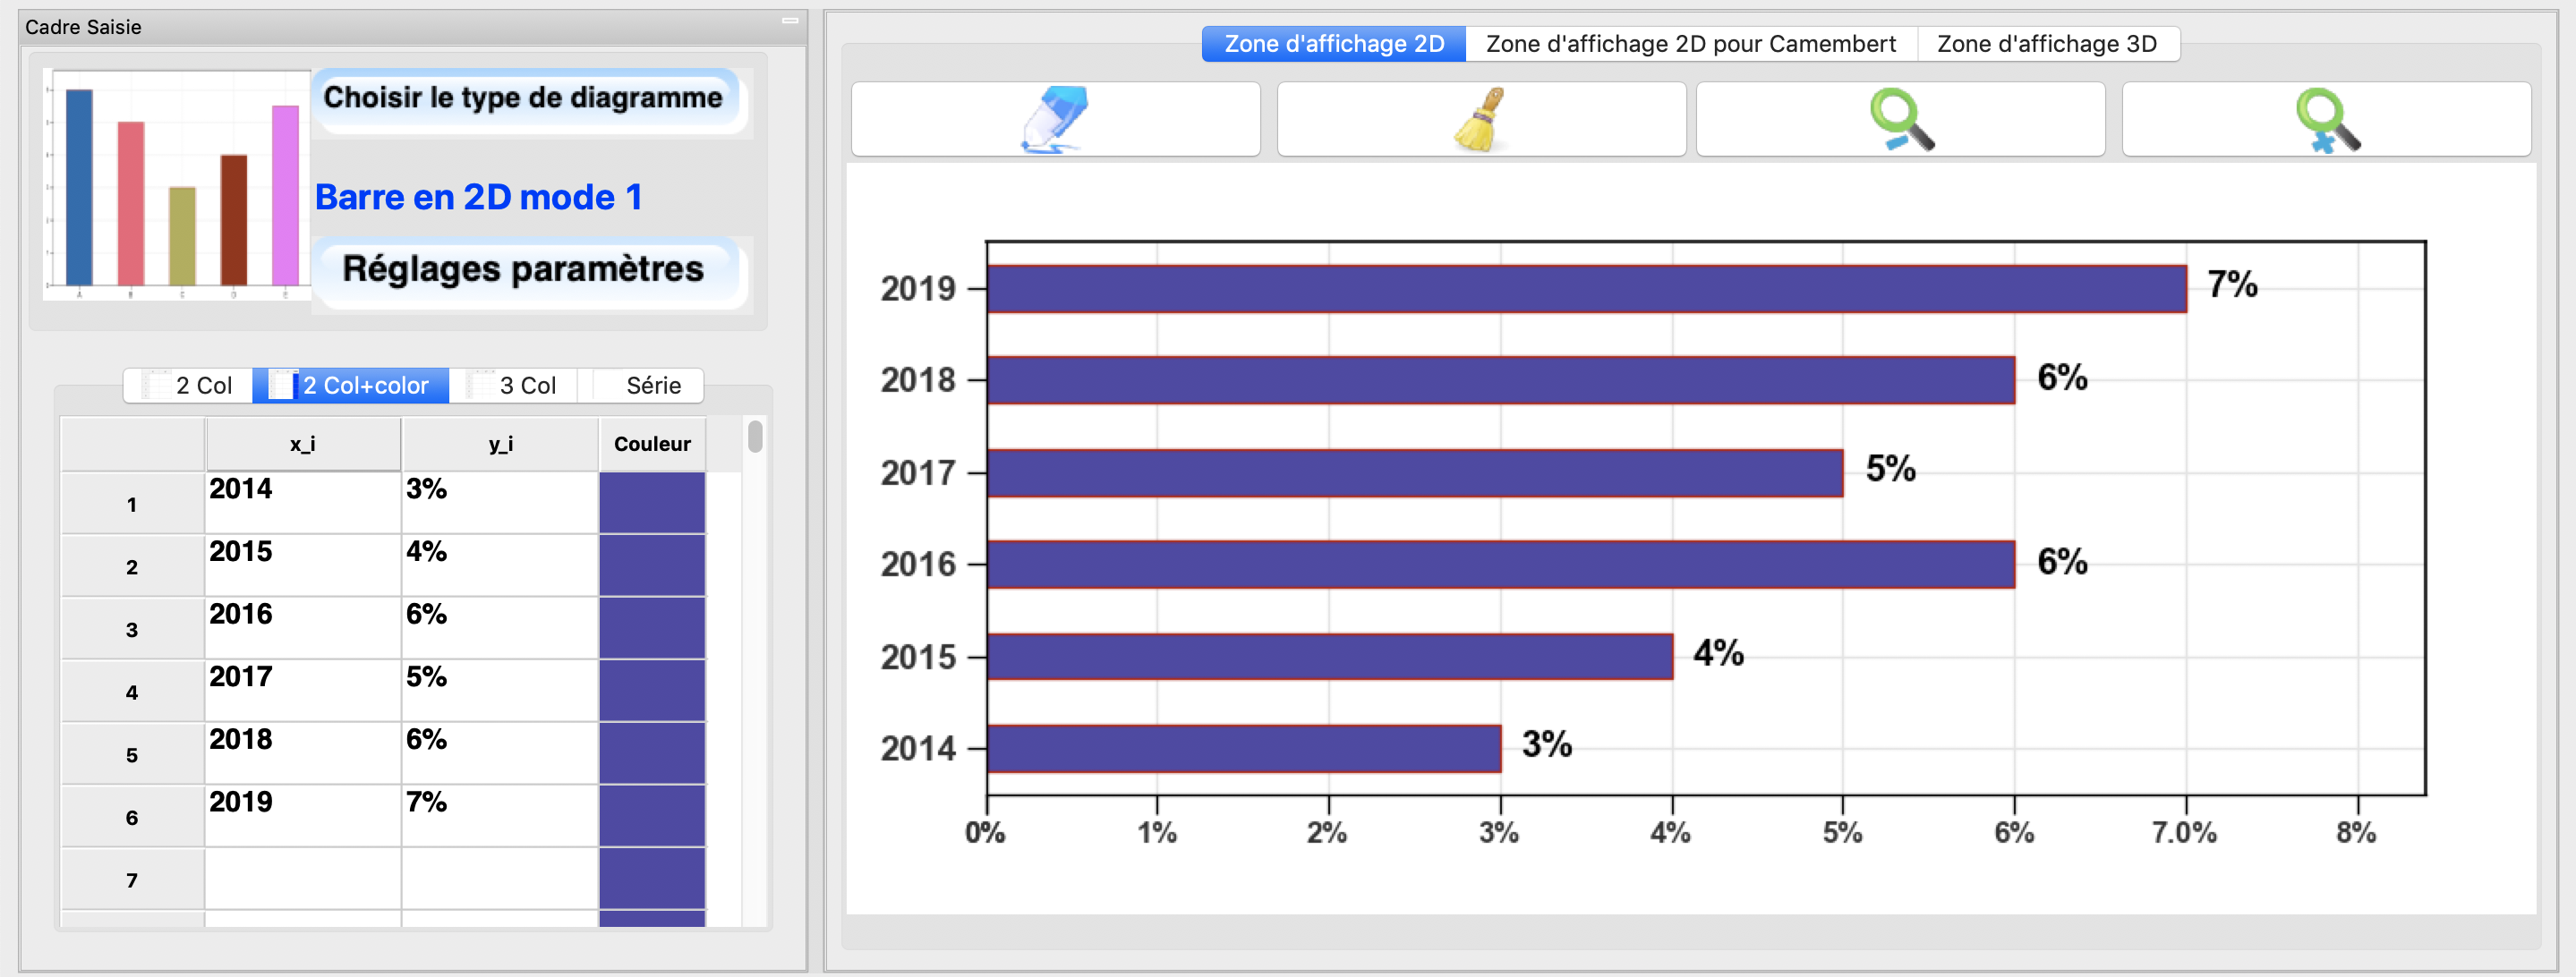
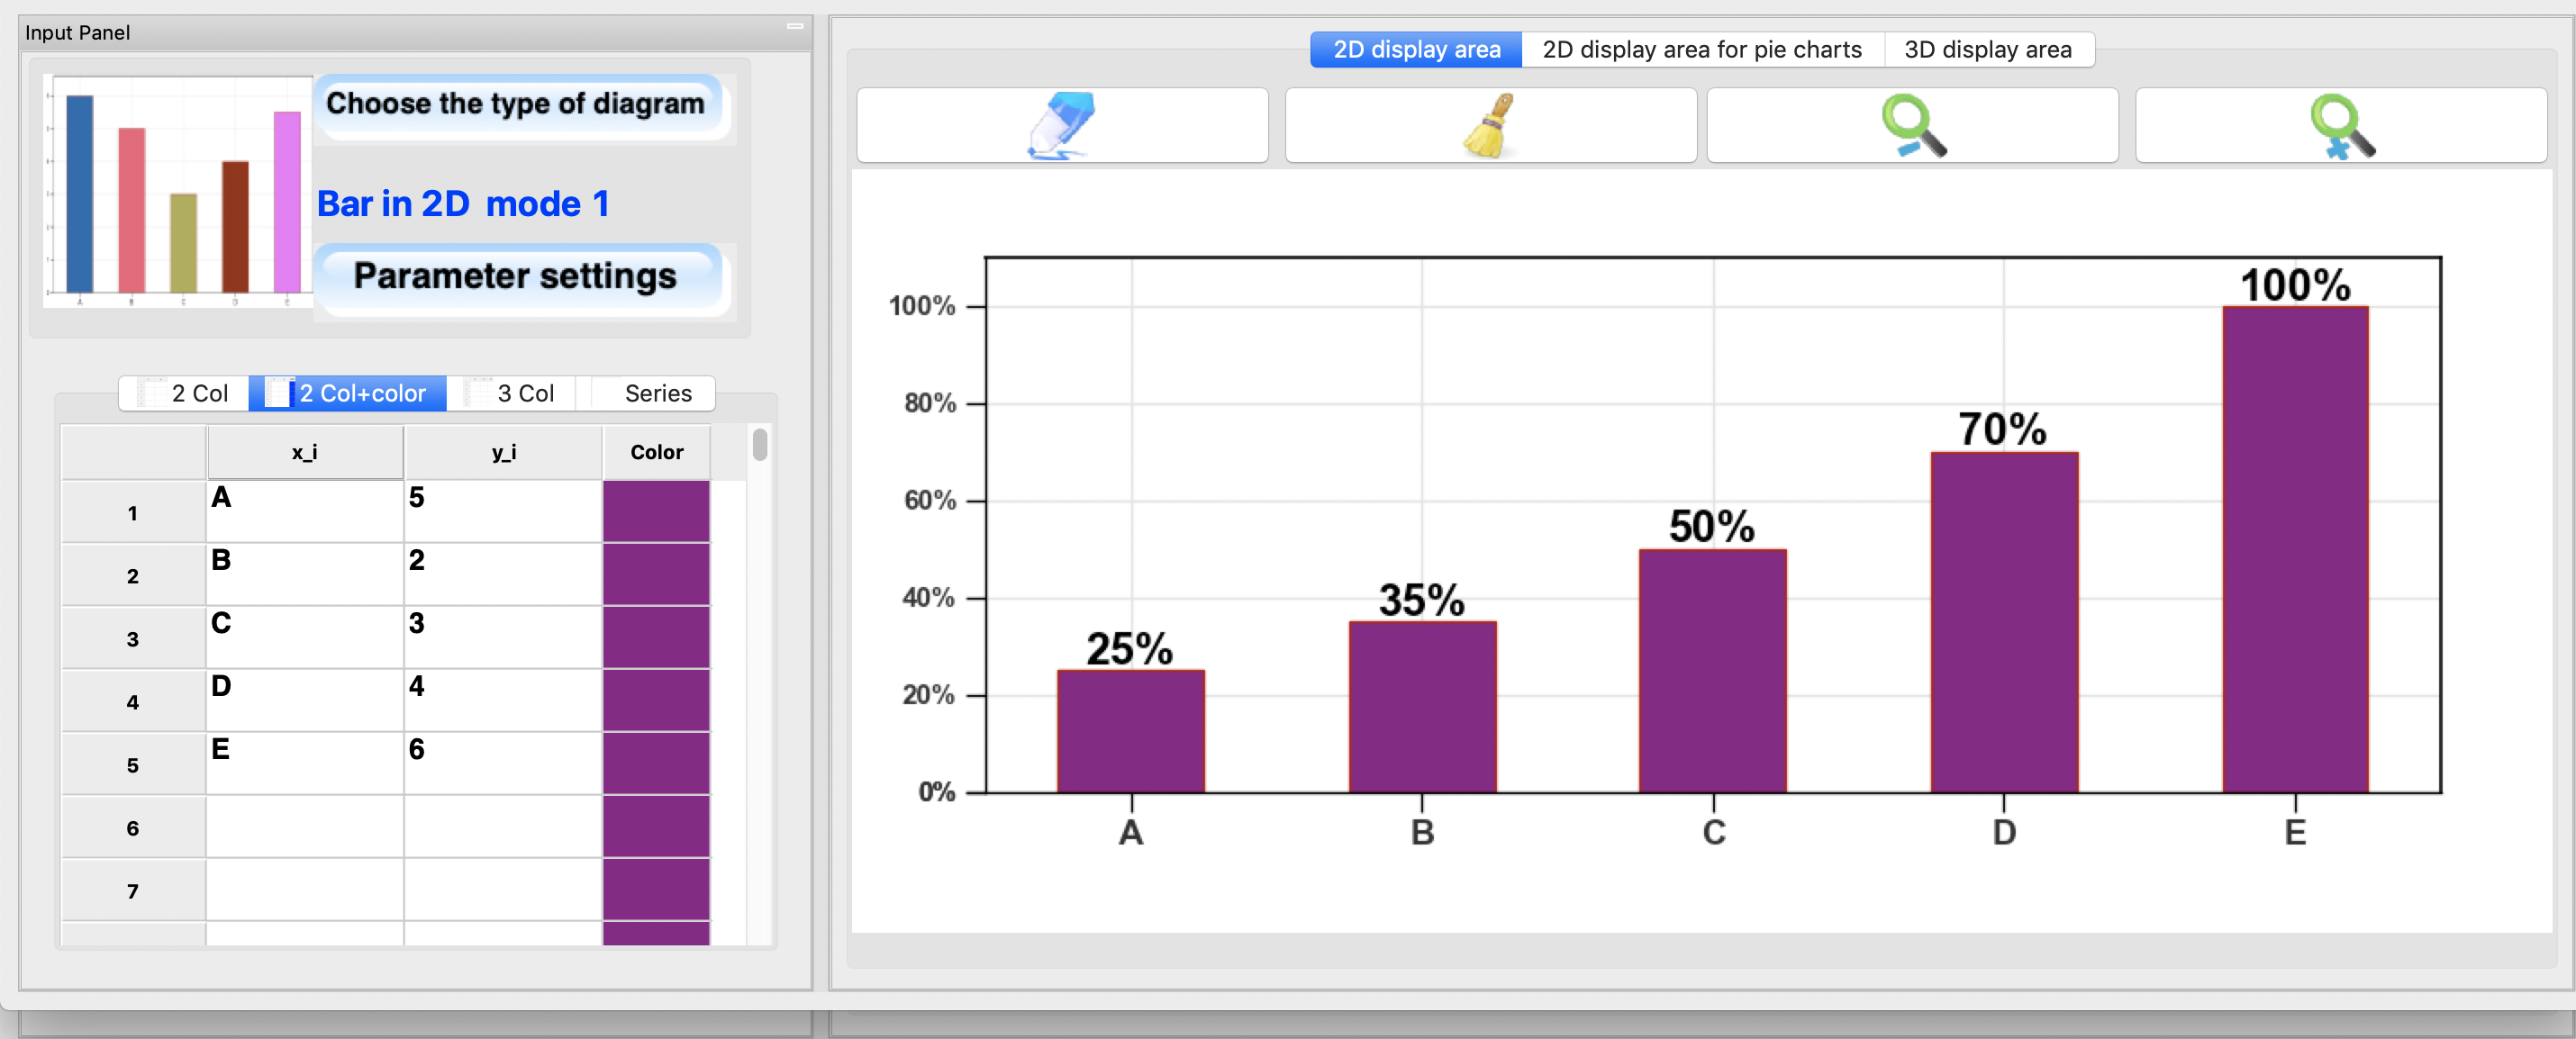
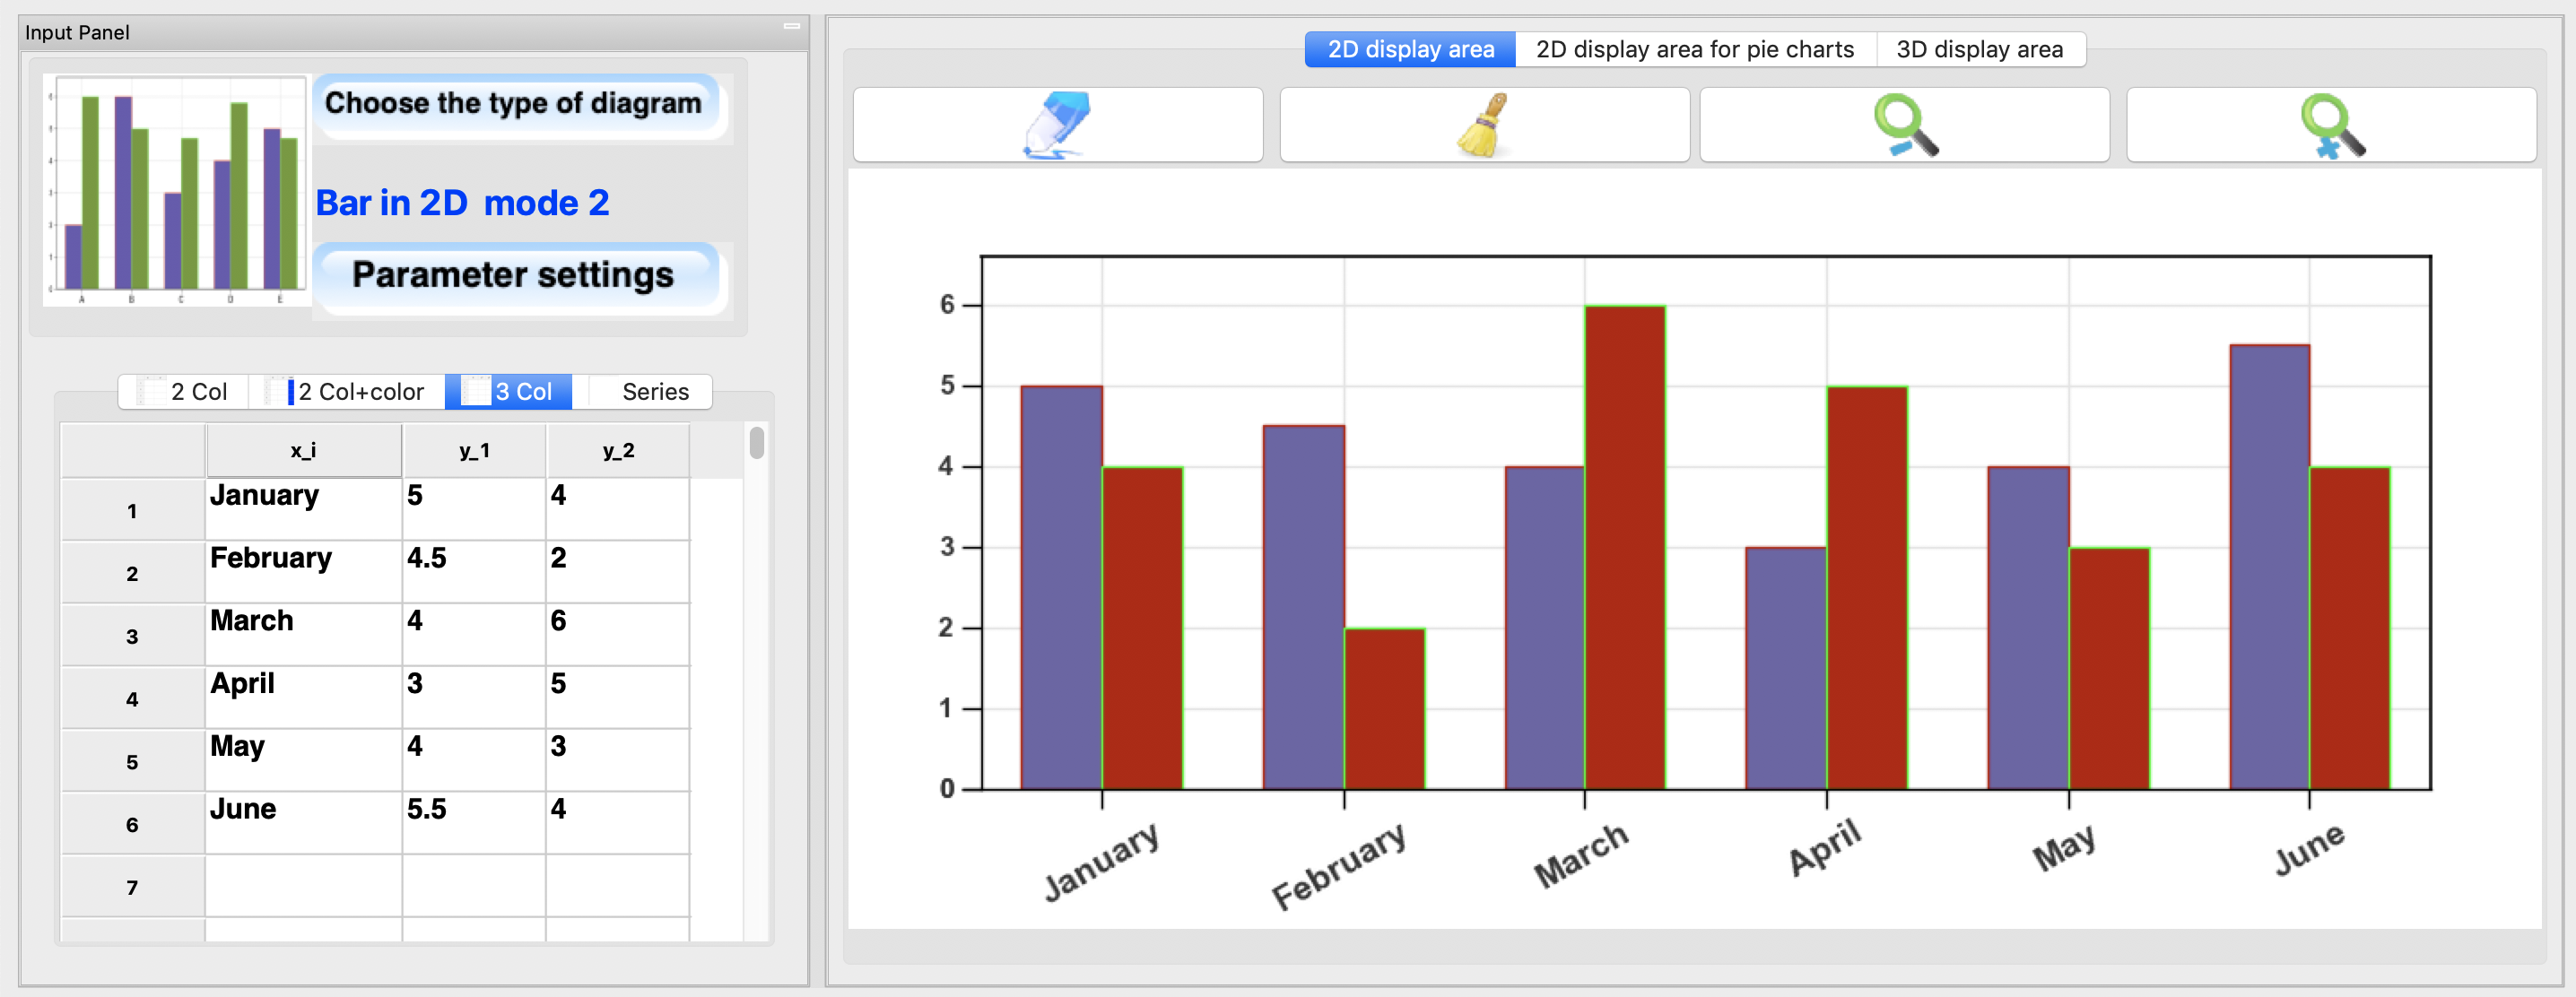
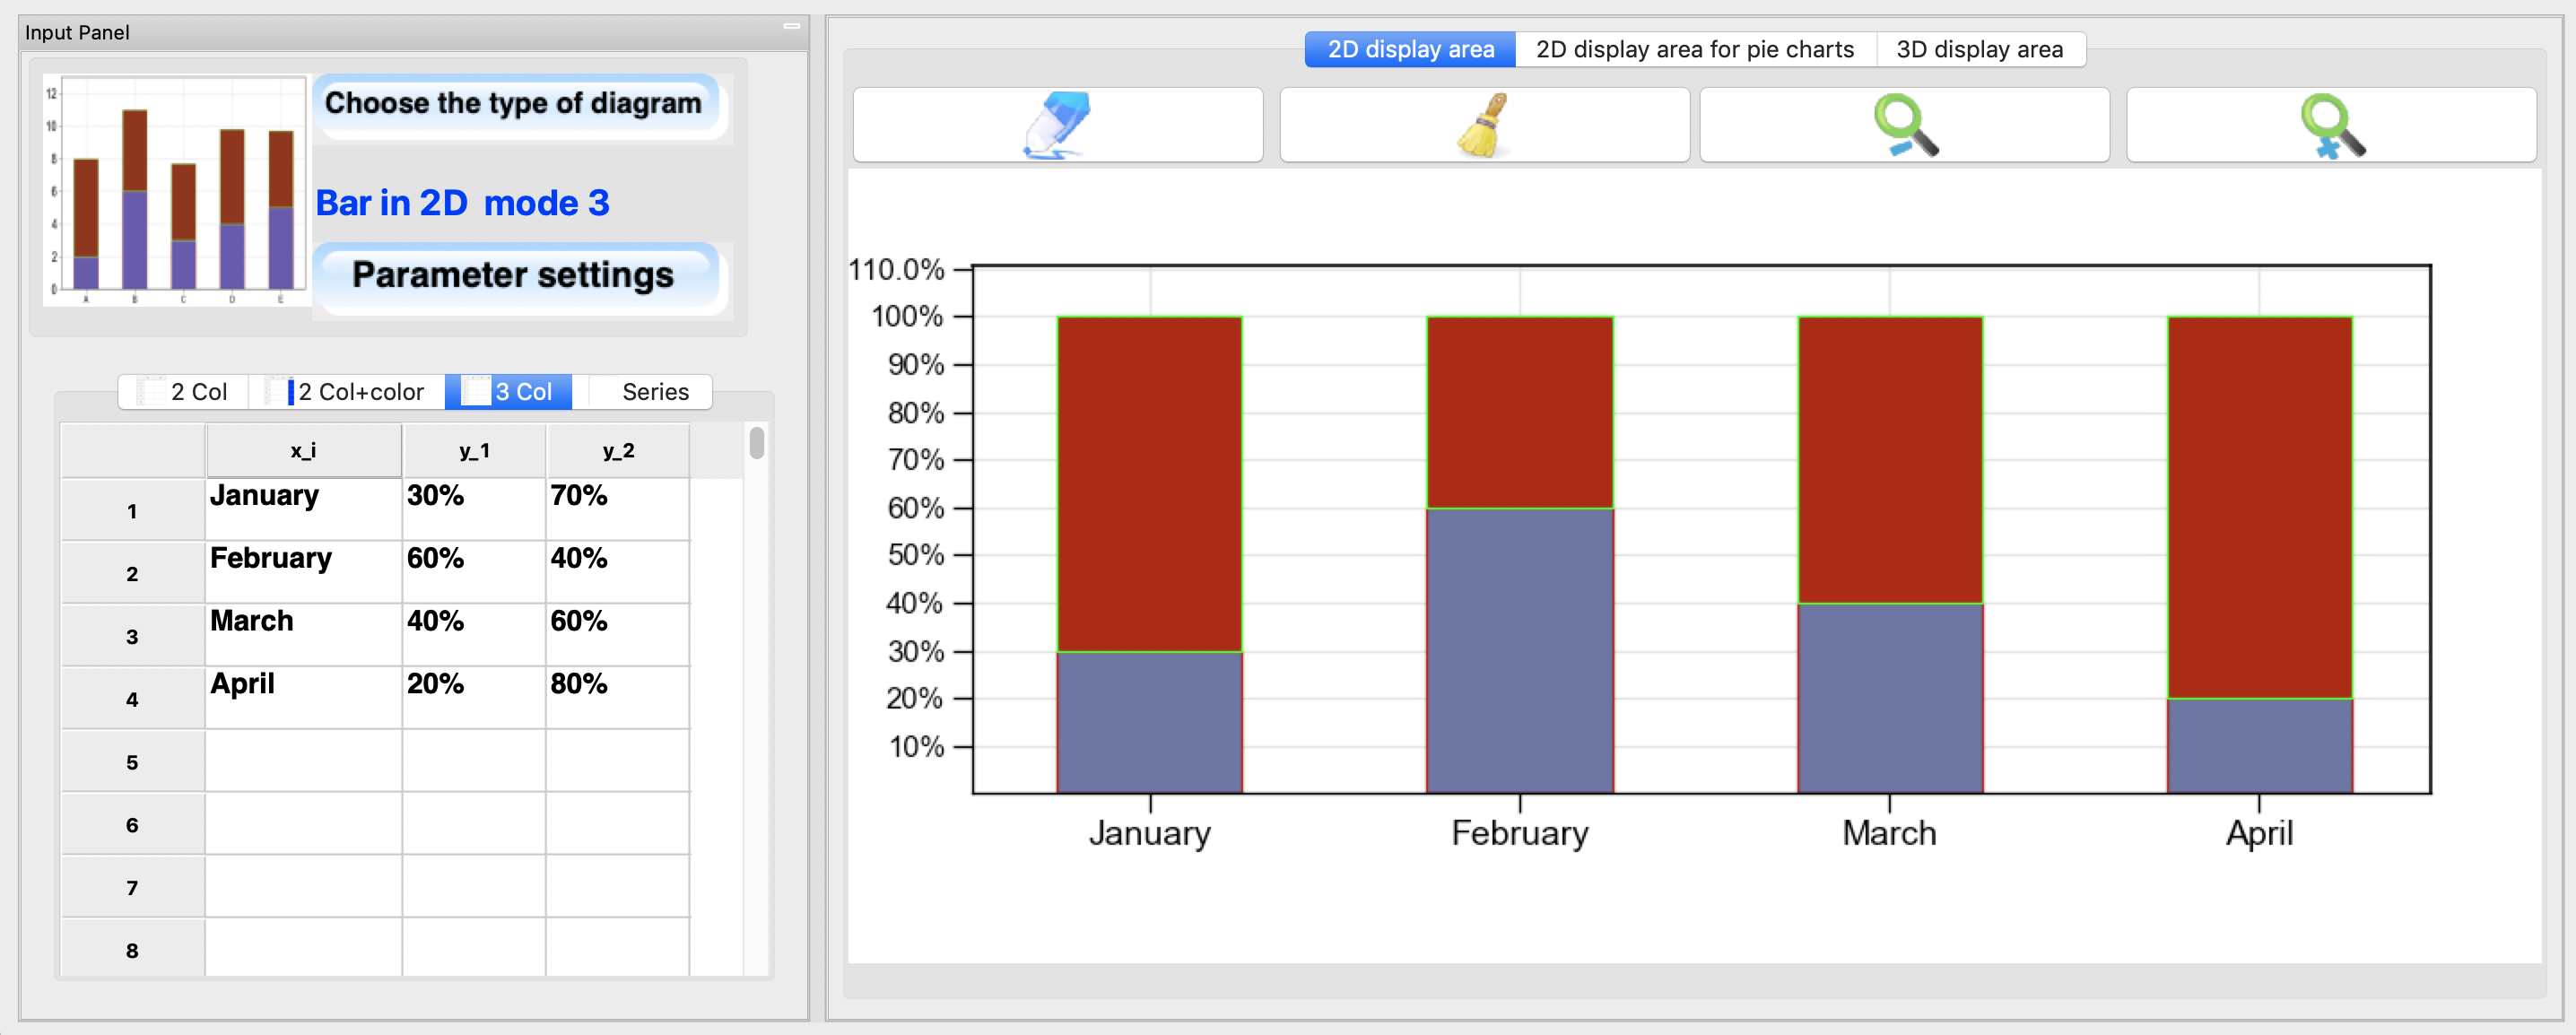
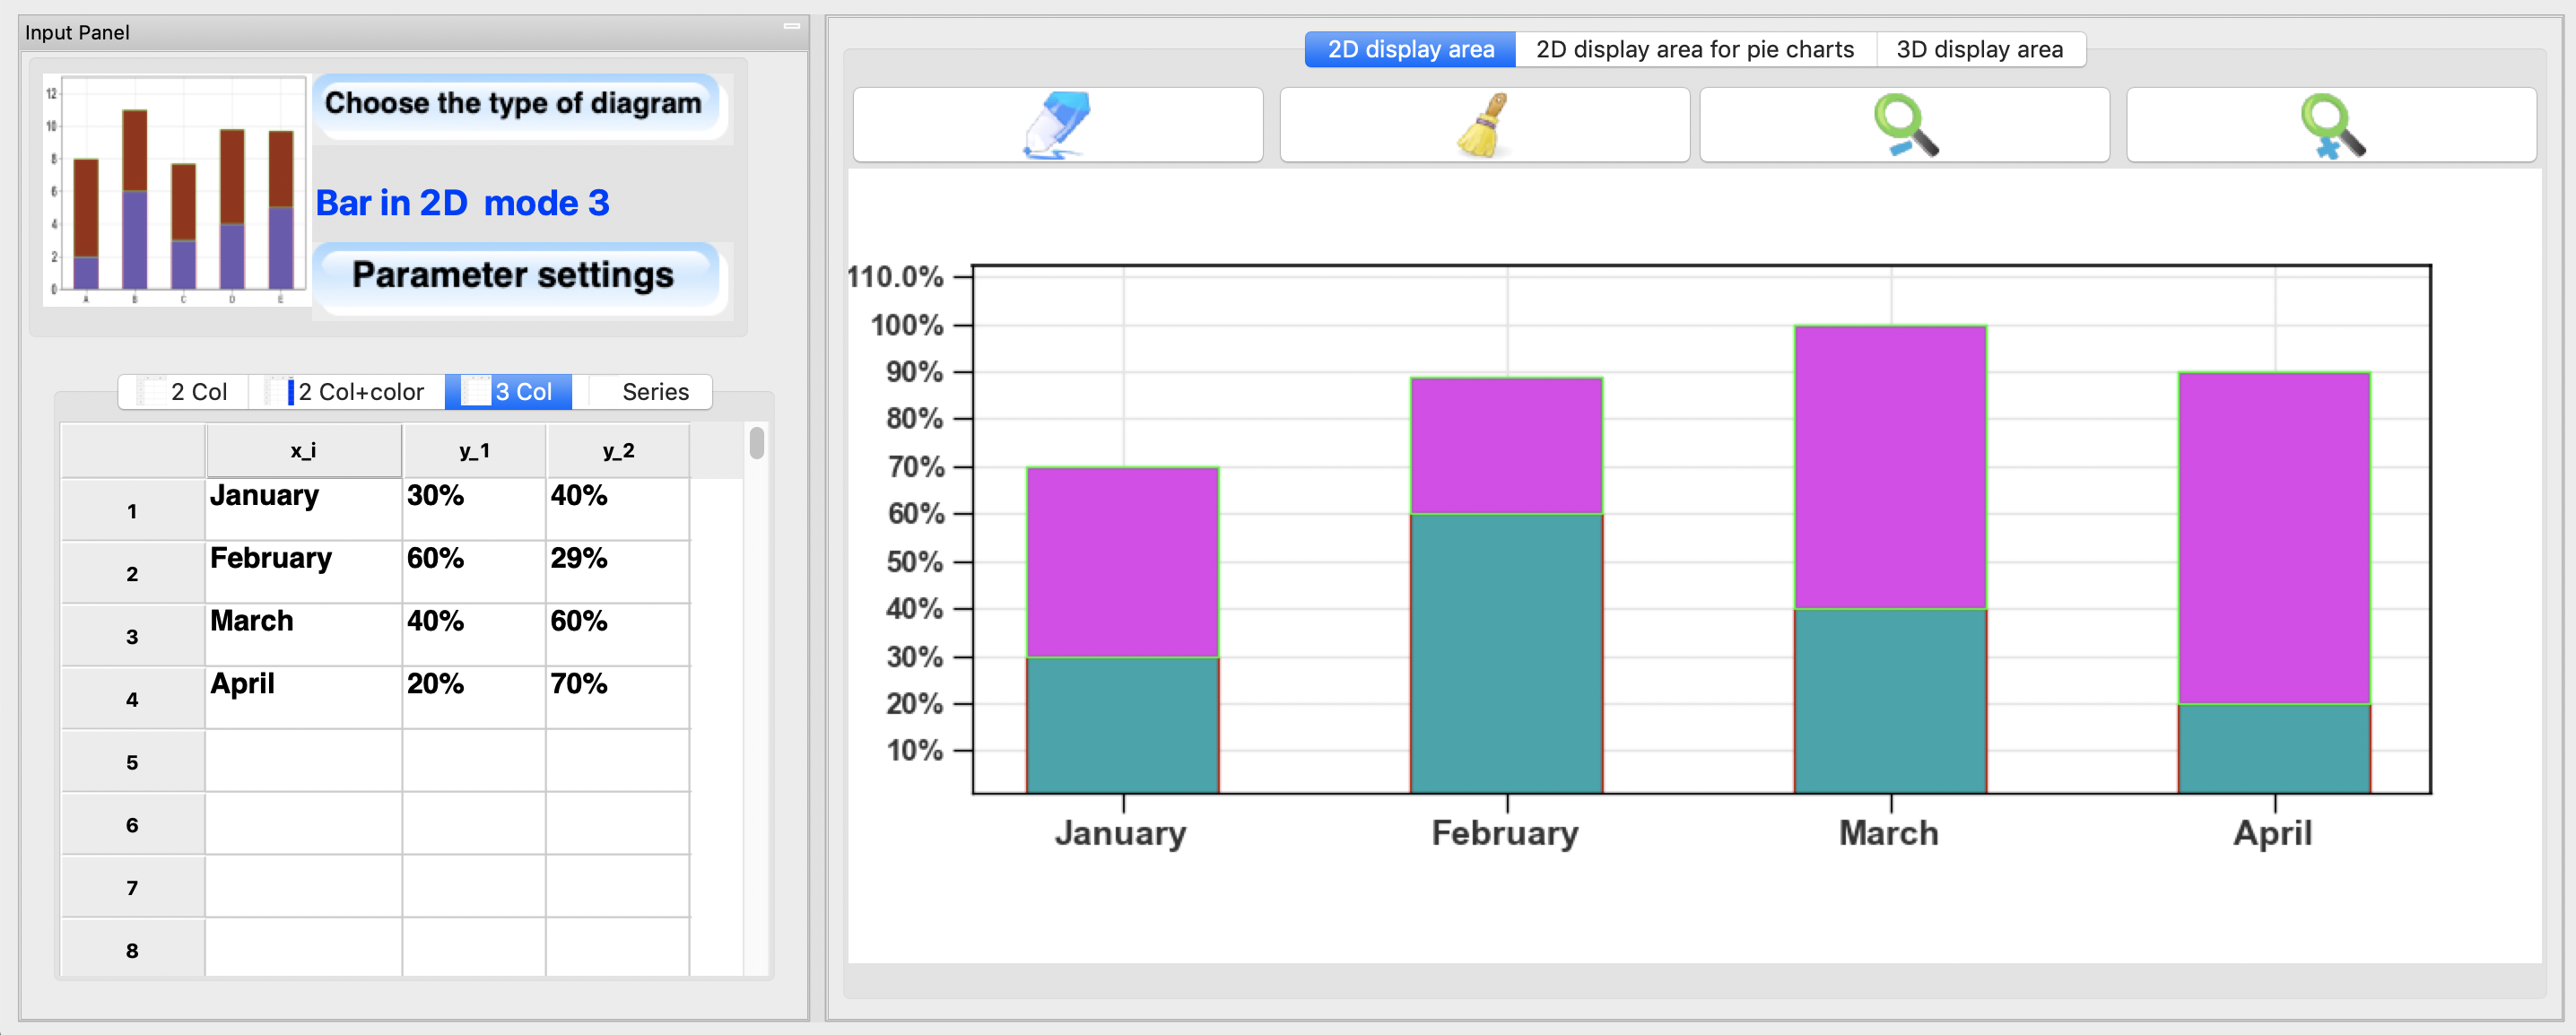
Two-dimensional bar charts
Note
In addition to the bar graph of frequencies, you can also draw the bar graph of the relative frequencies and cumulative frequencies (ascending or decreasing order). You can also draw the Pareto chart.
To draw the bar chart of the cumulative frequencies (increasing order), first click on the Settings Parameters button, the settings panel will open, for frequencies select Enable and for cumulative select Increasing order.
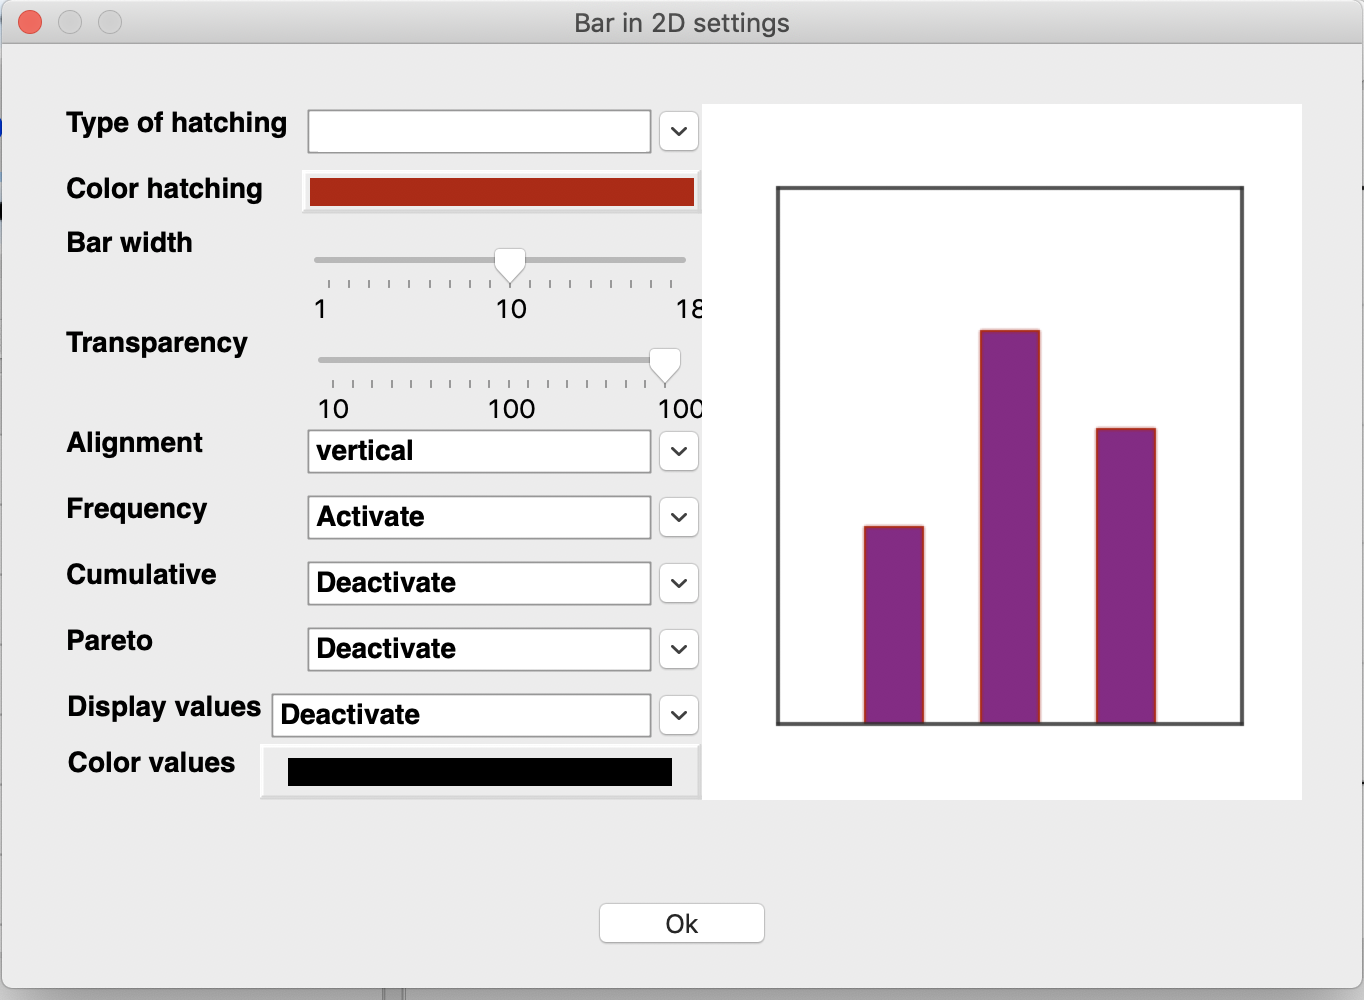
Note
You can also draw two diagrams in parallel either by juxtaposing them or by aligning them.
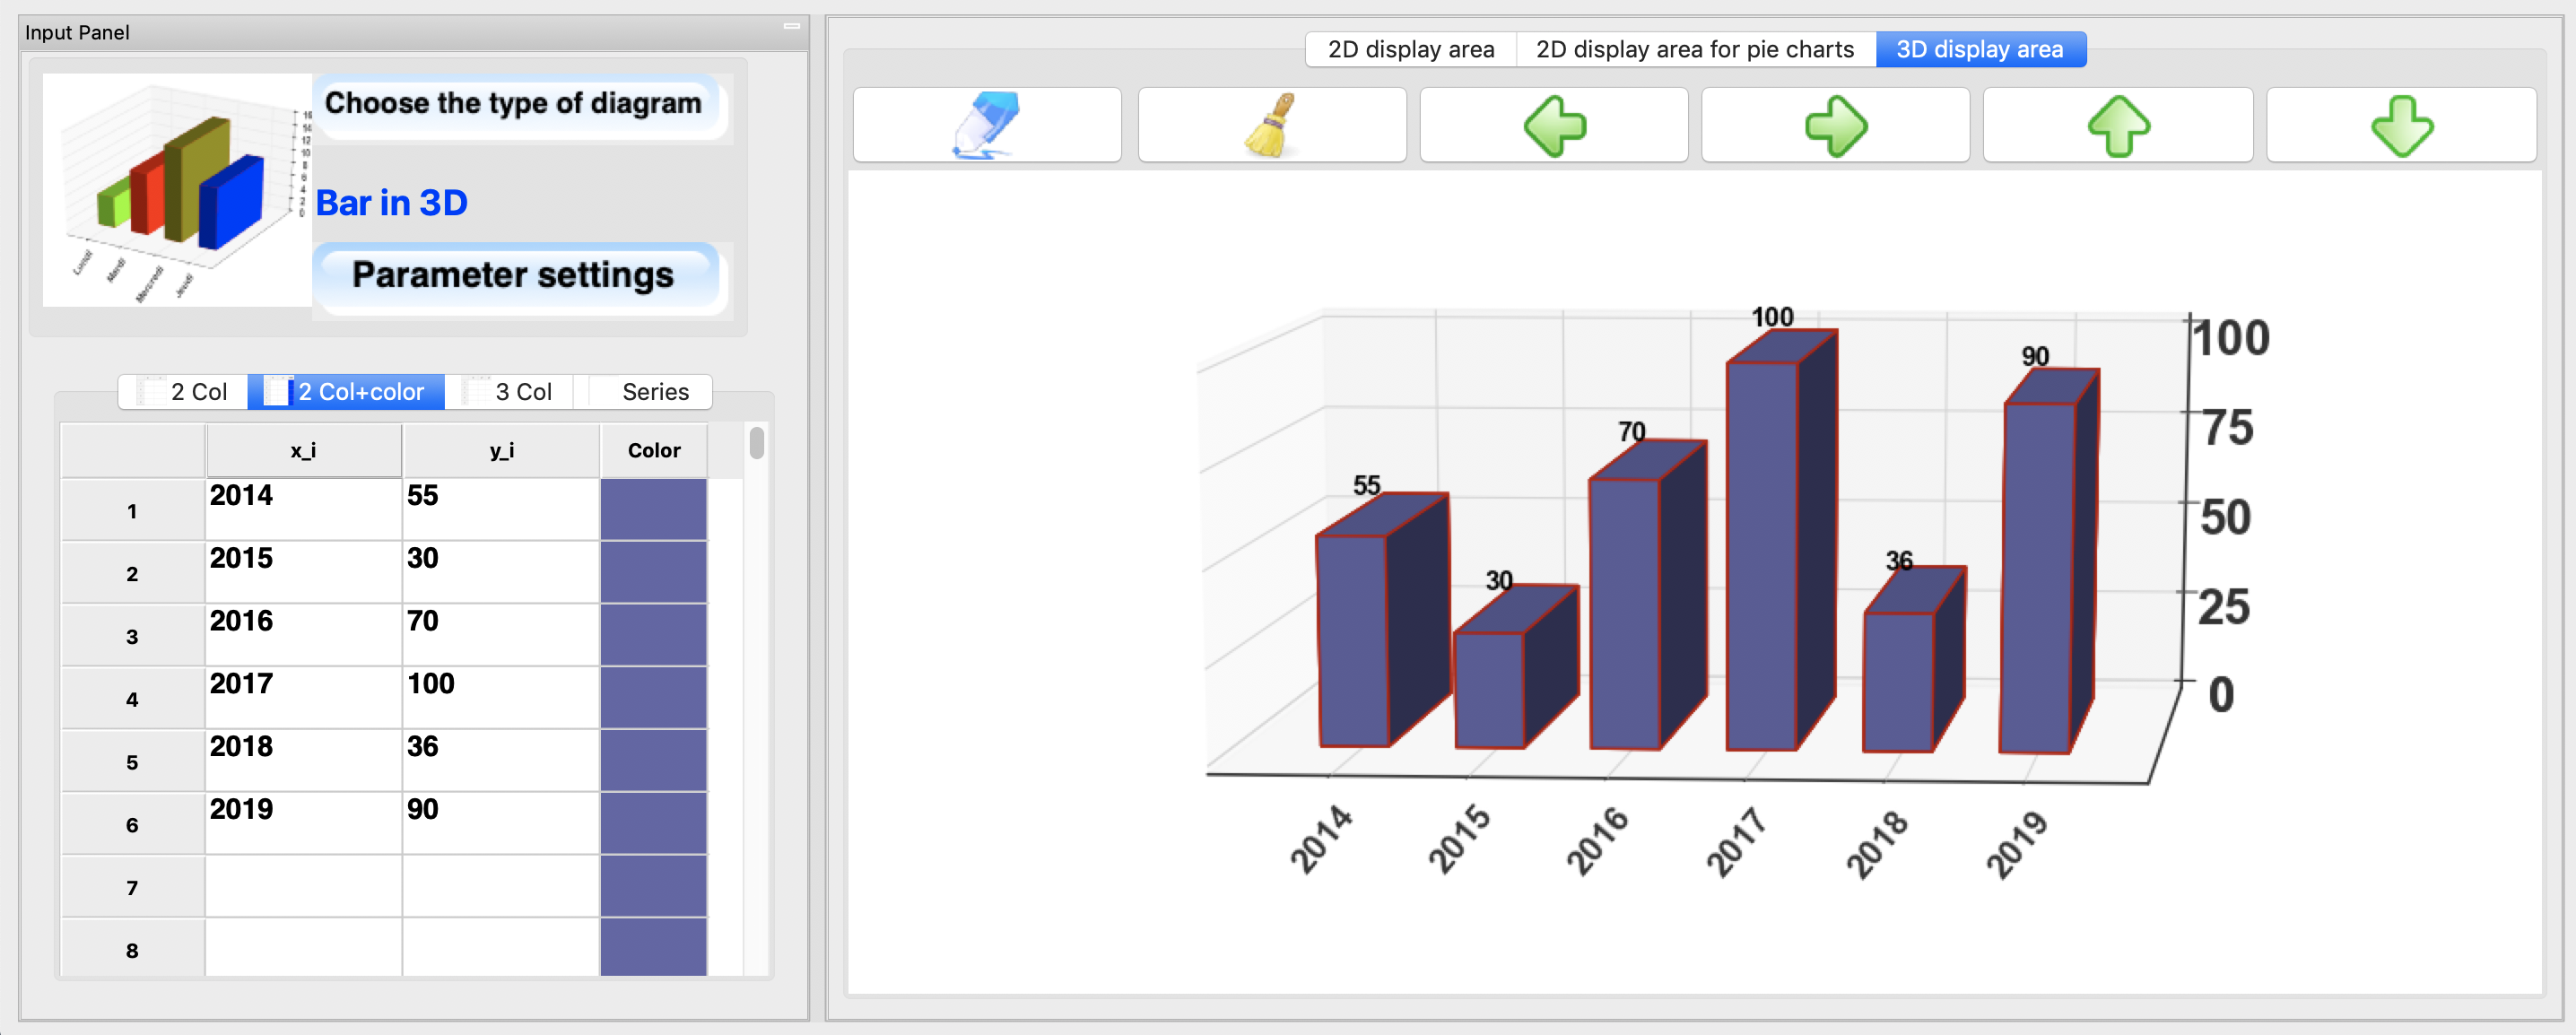
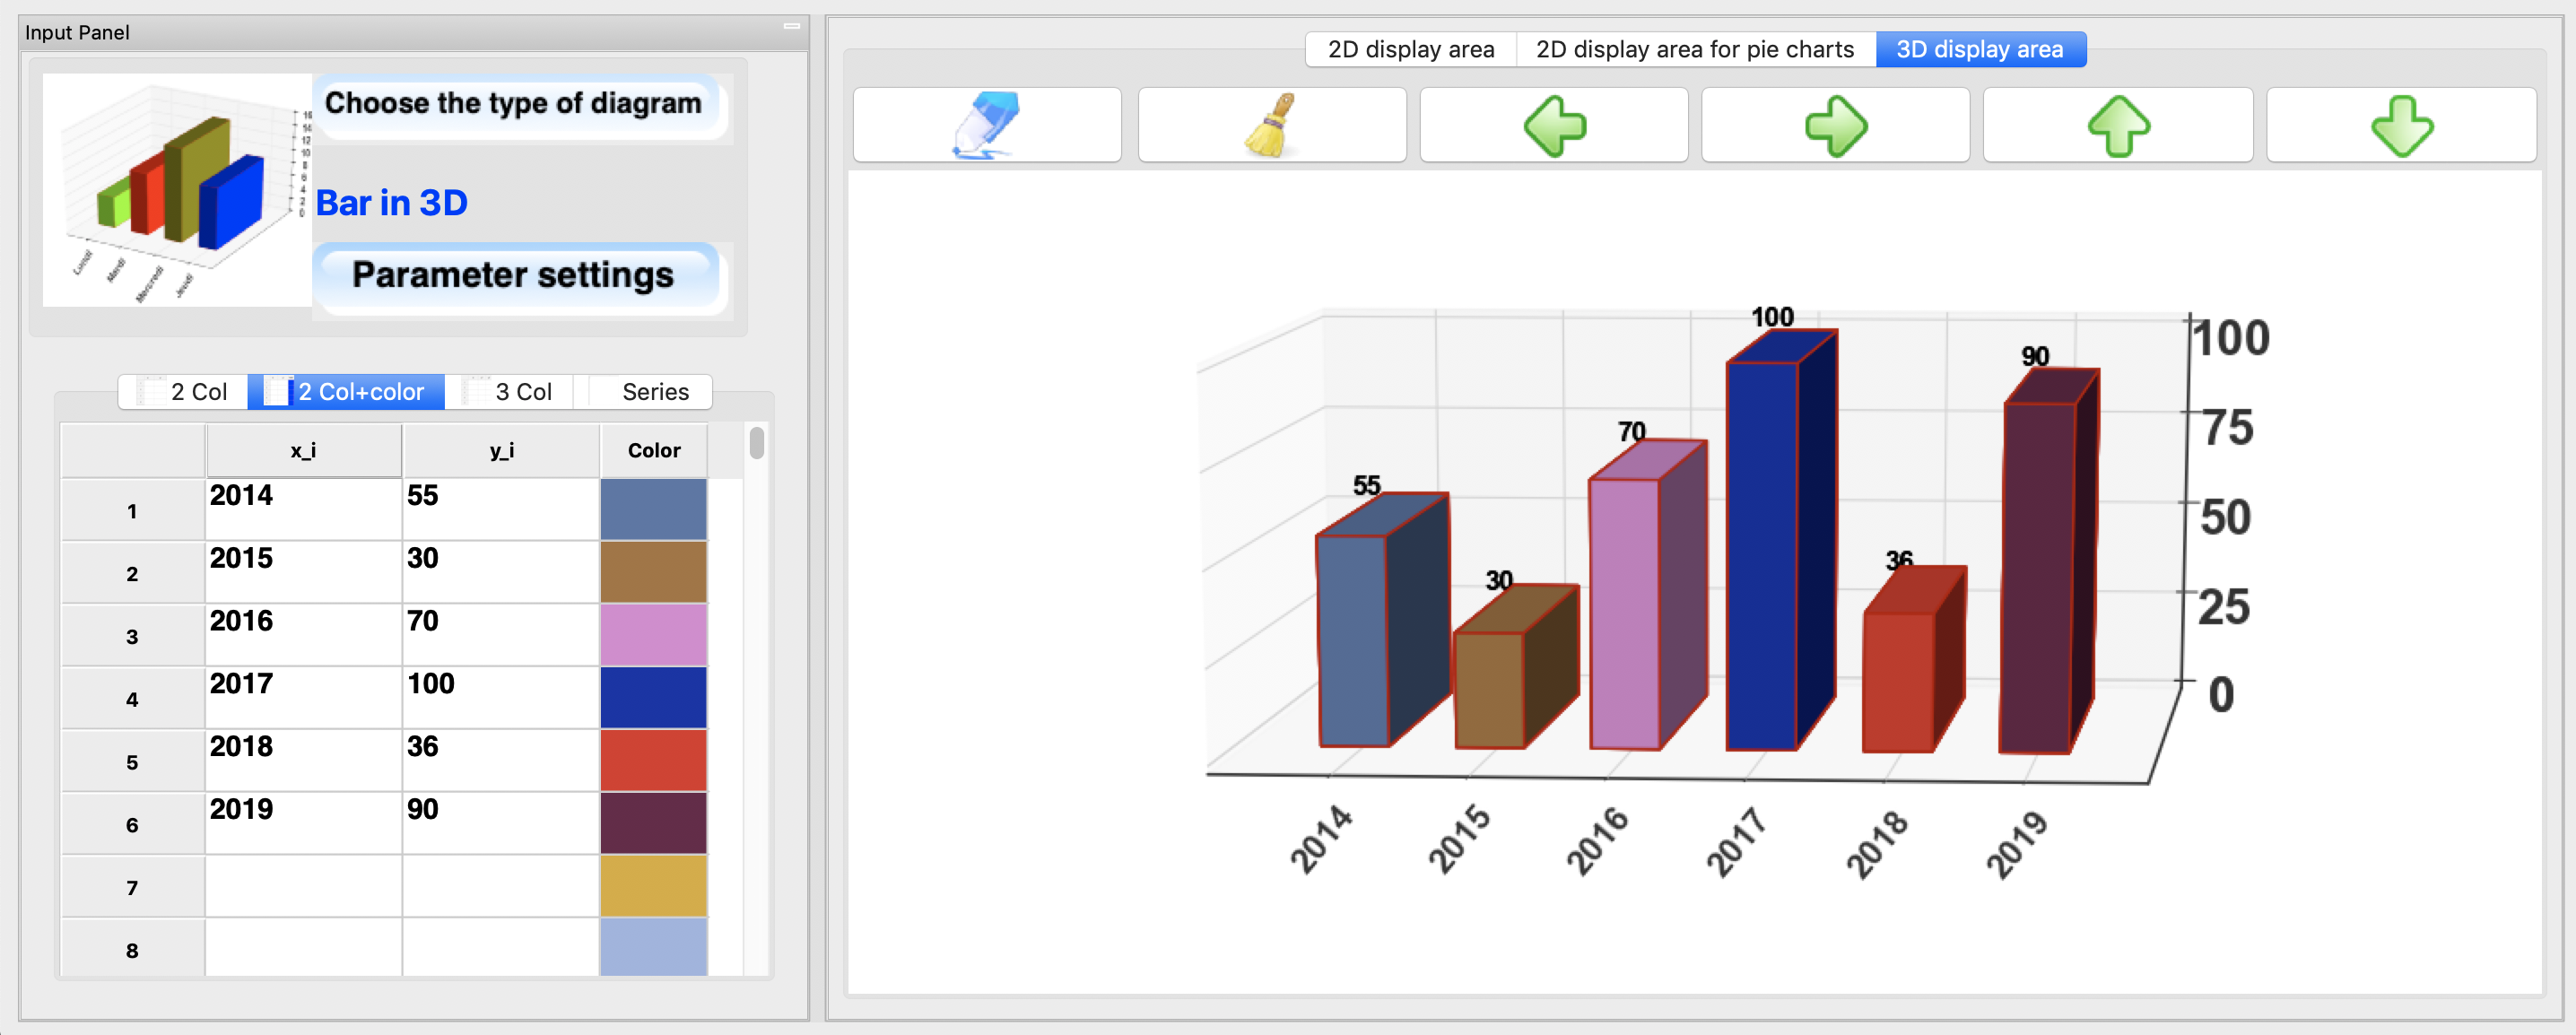
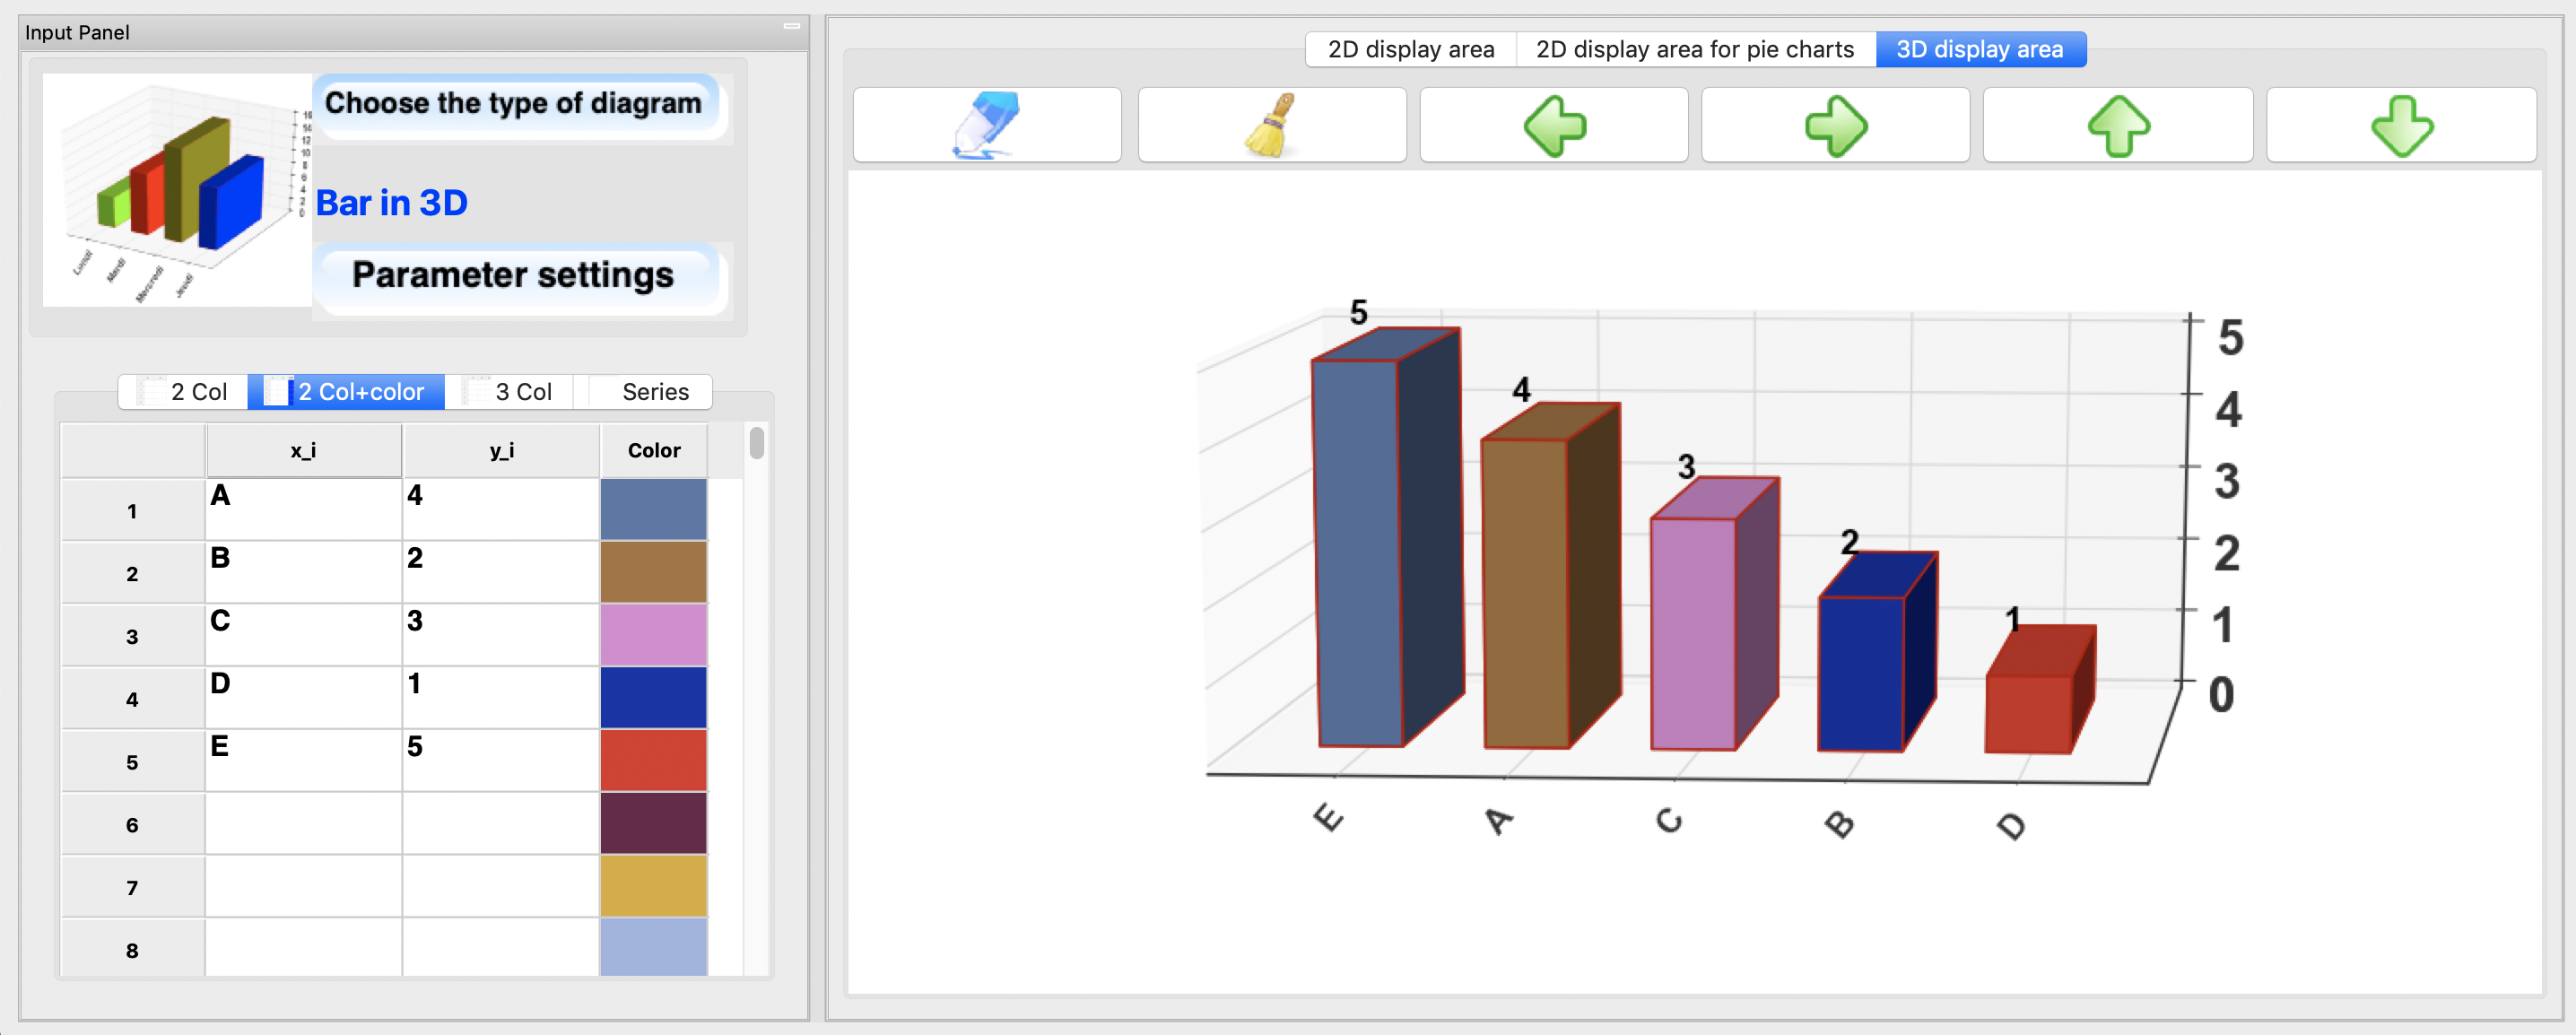
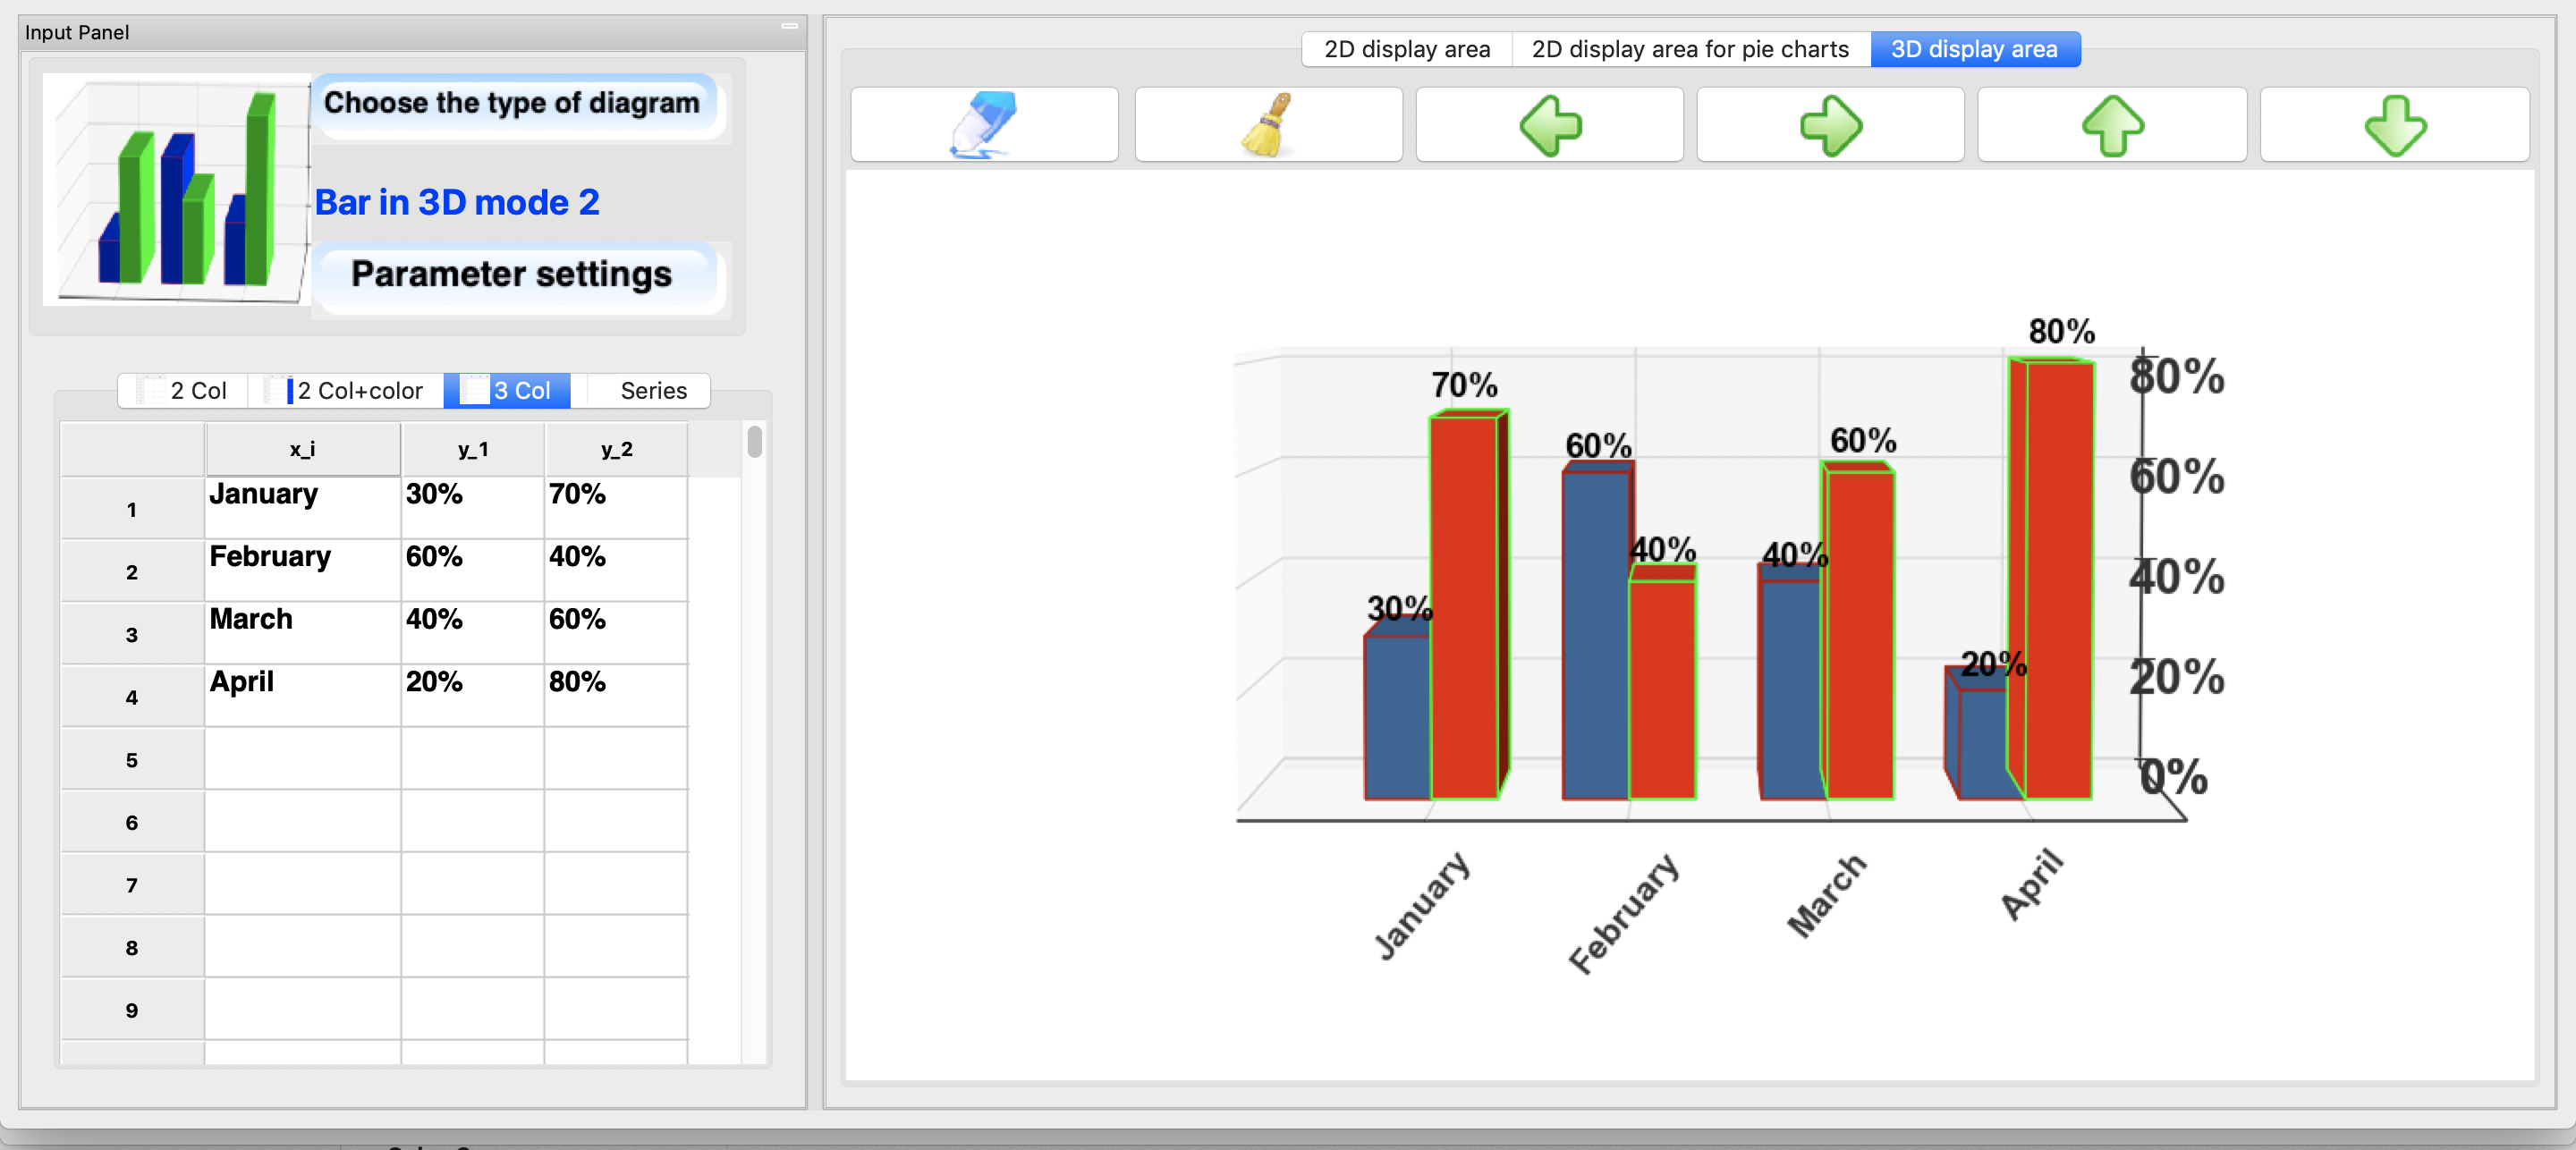
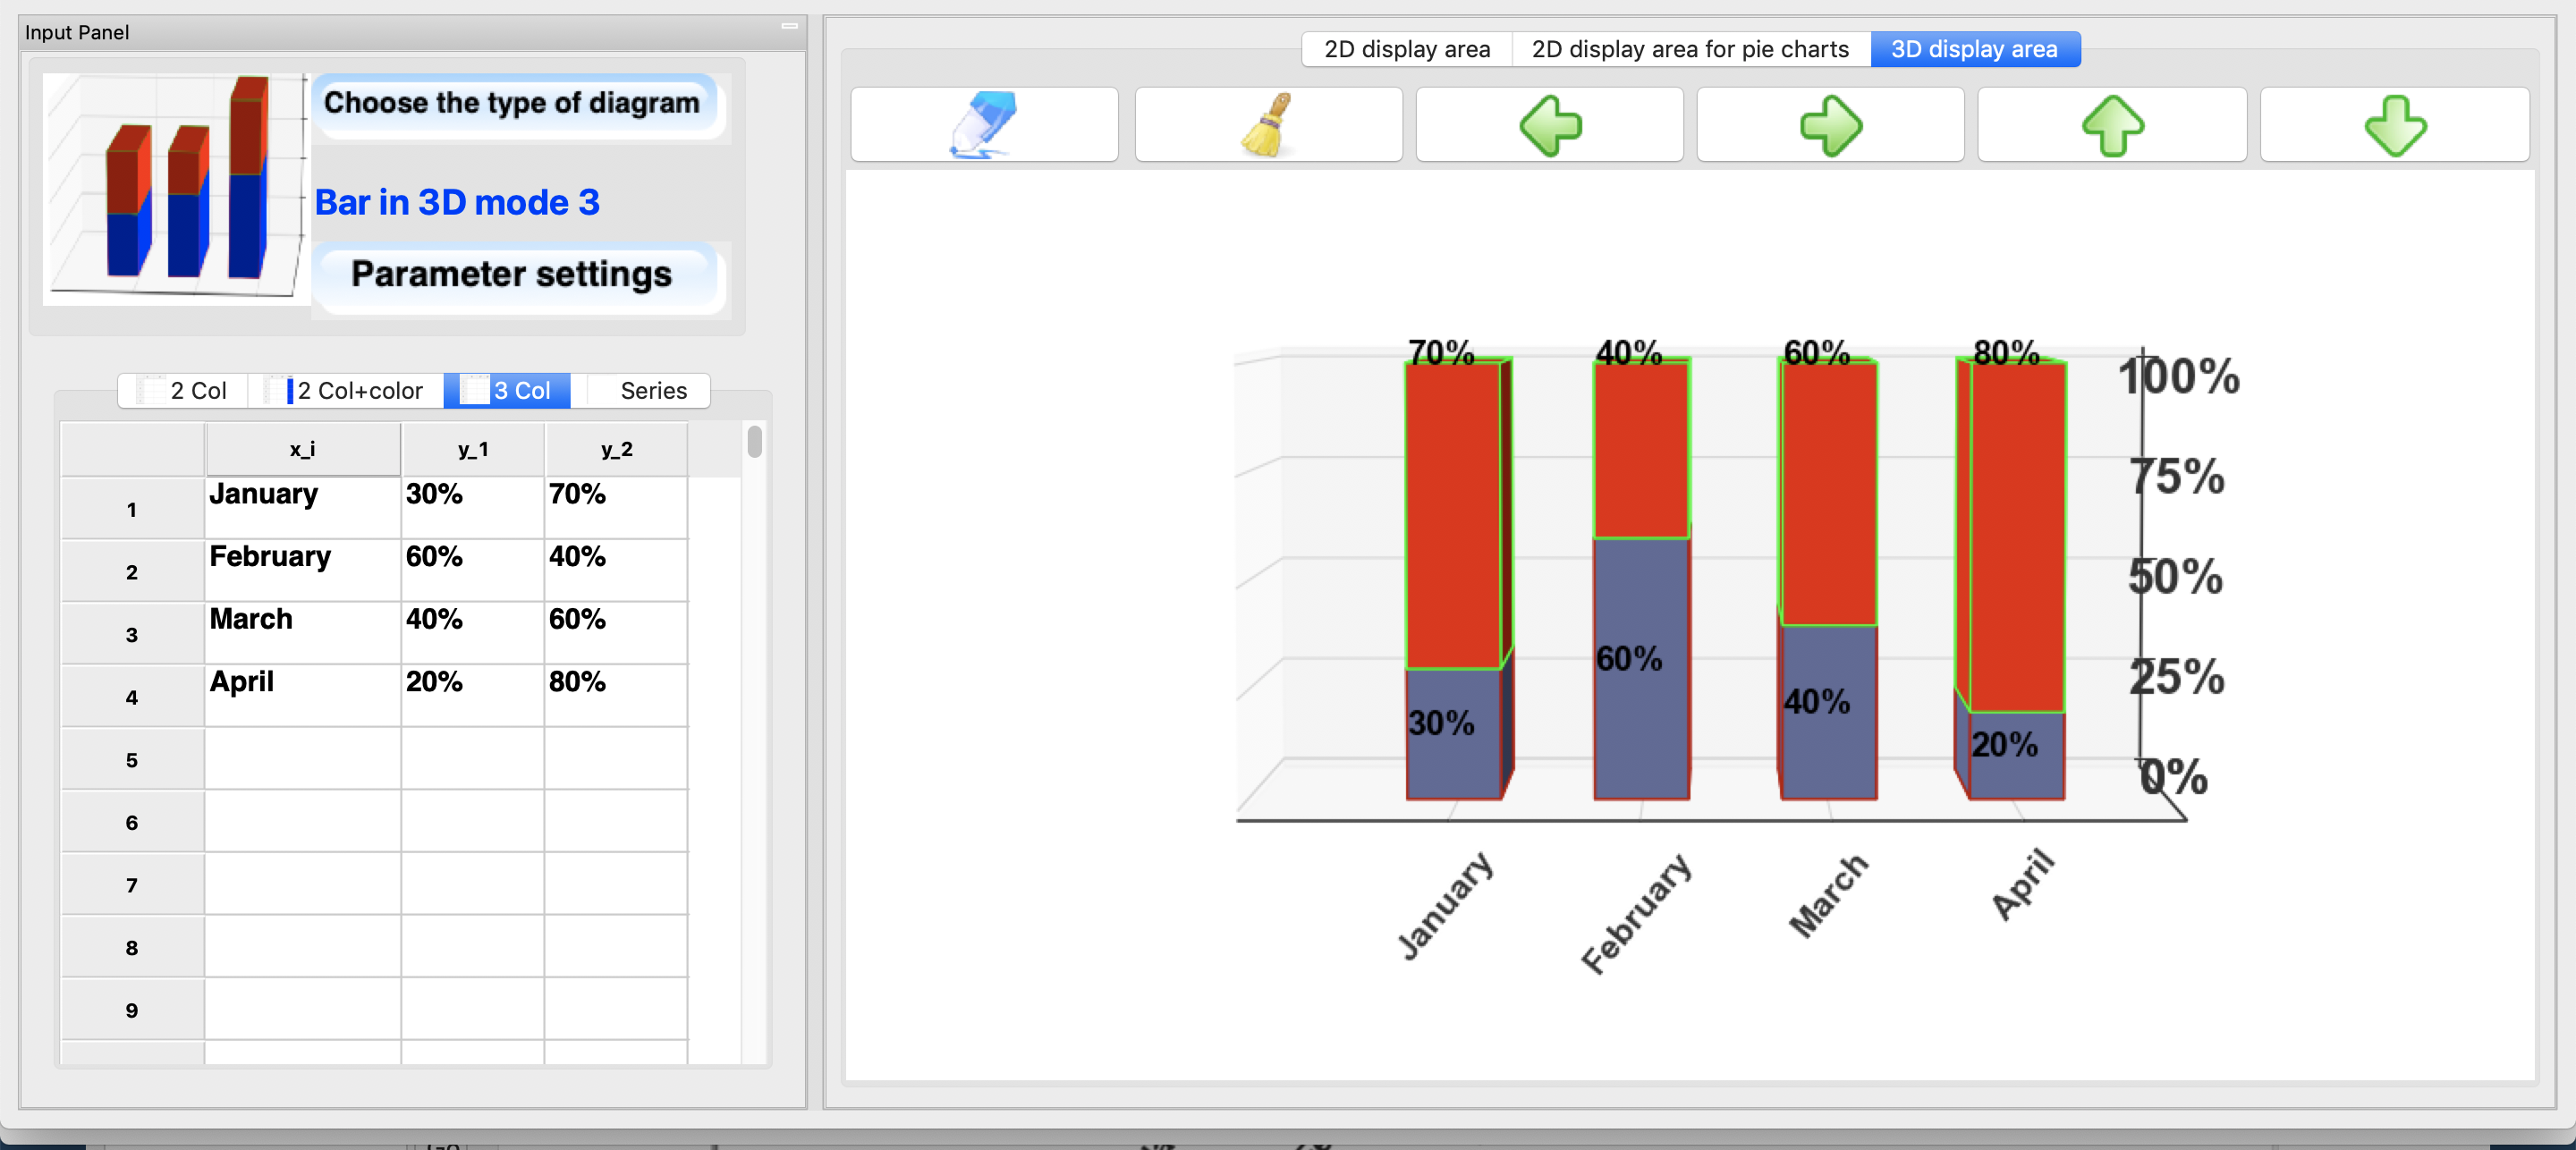
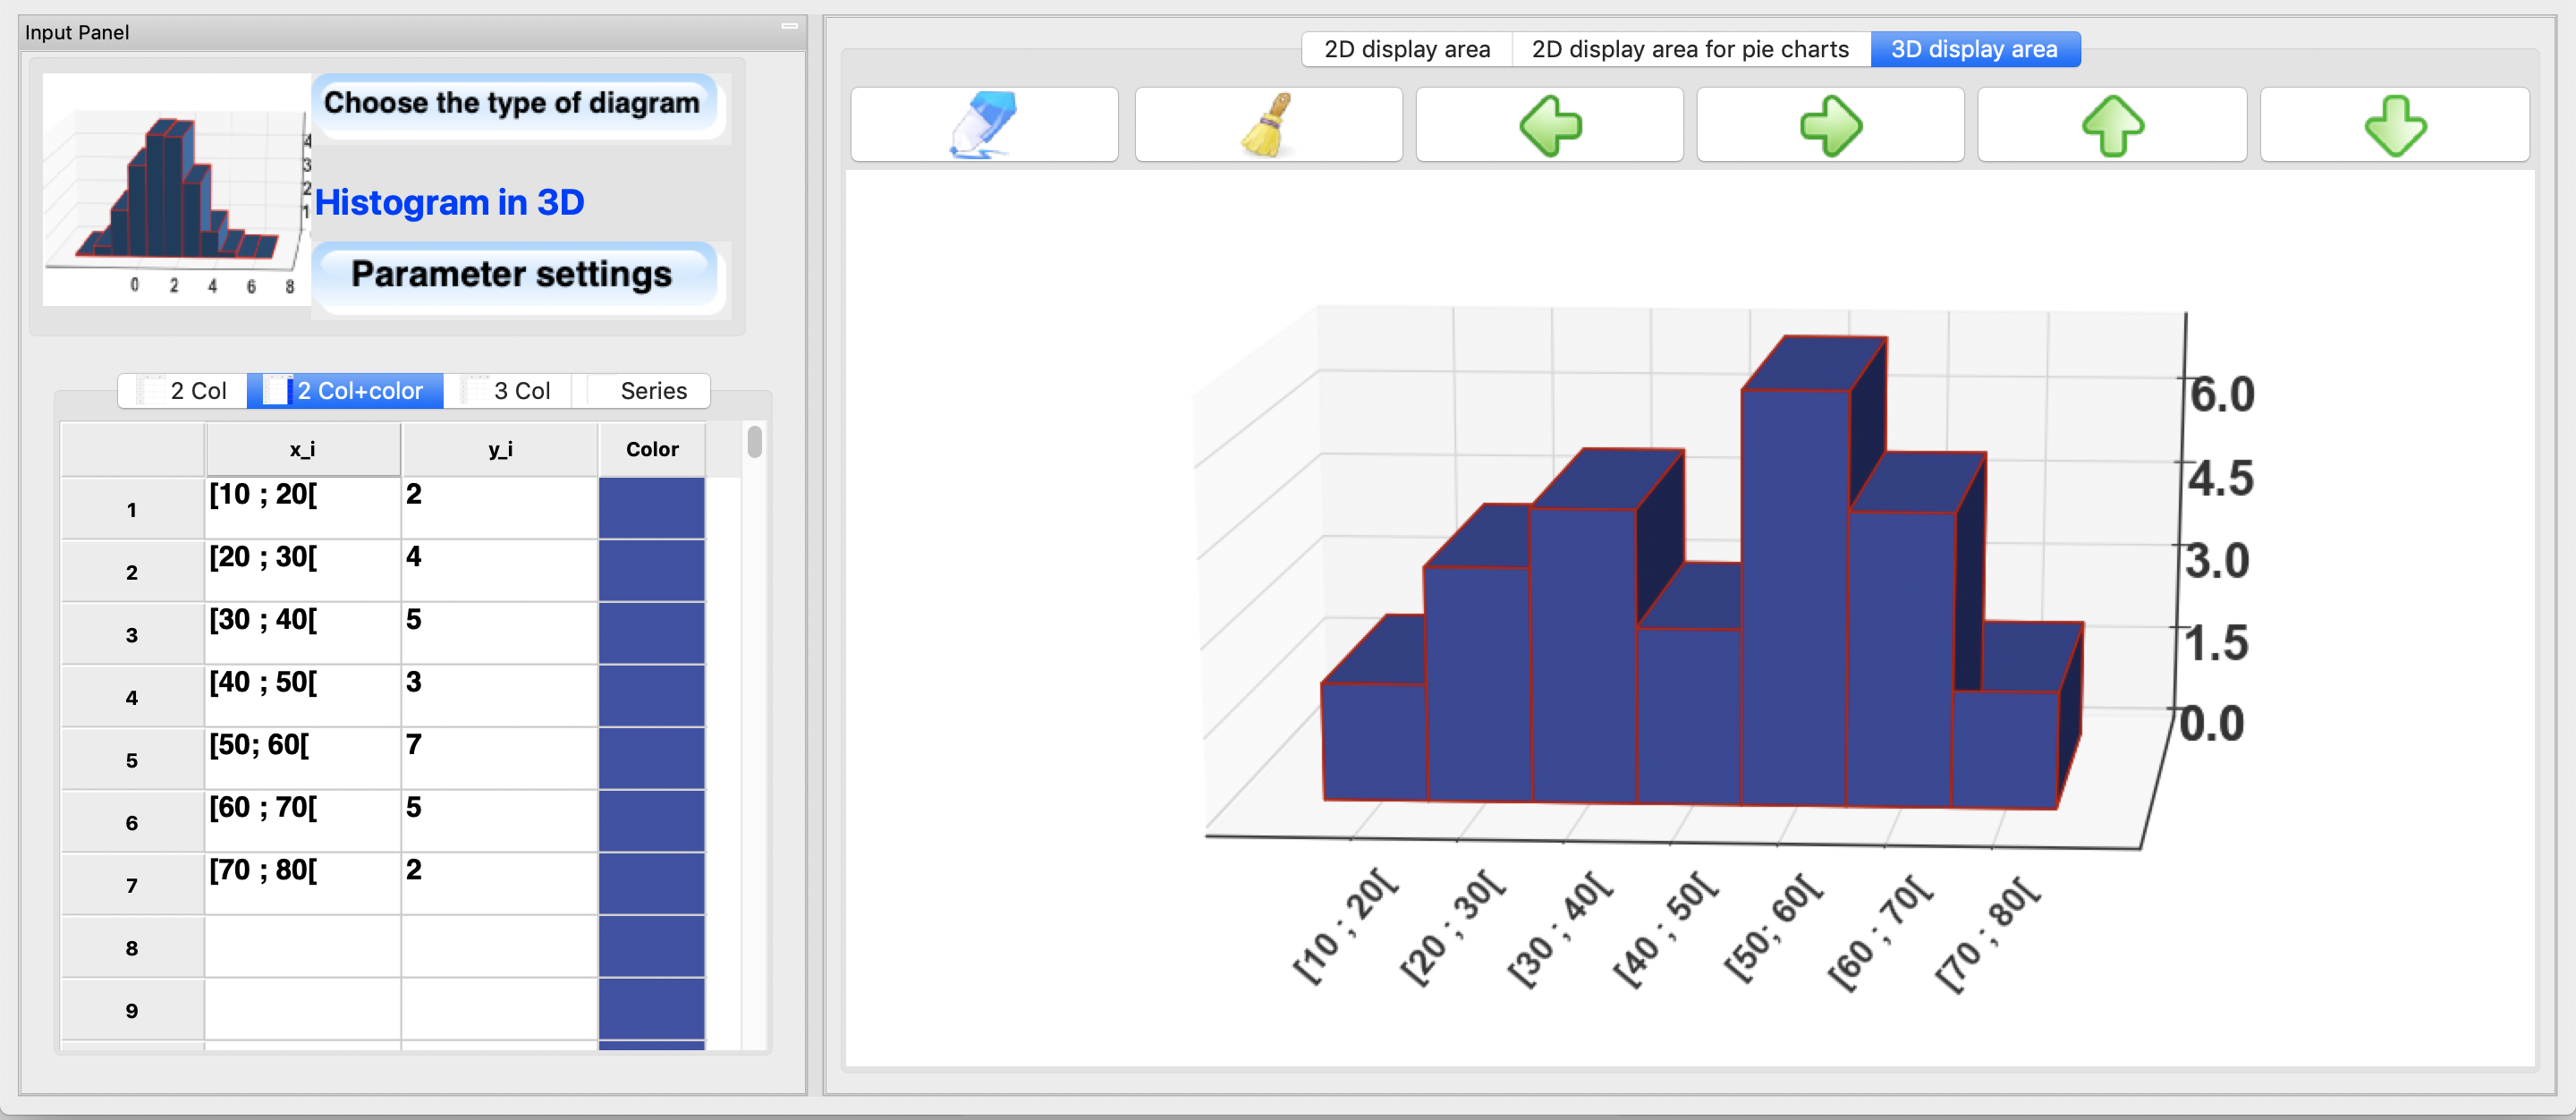
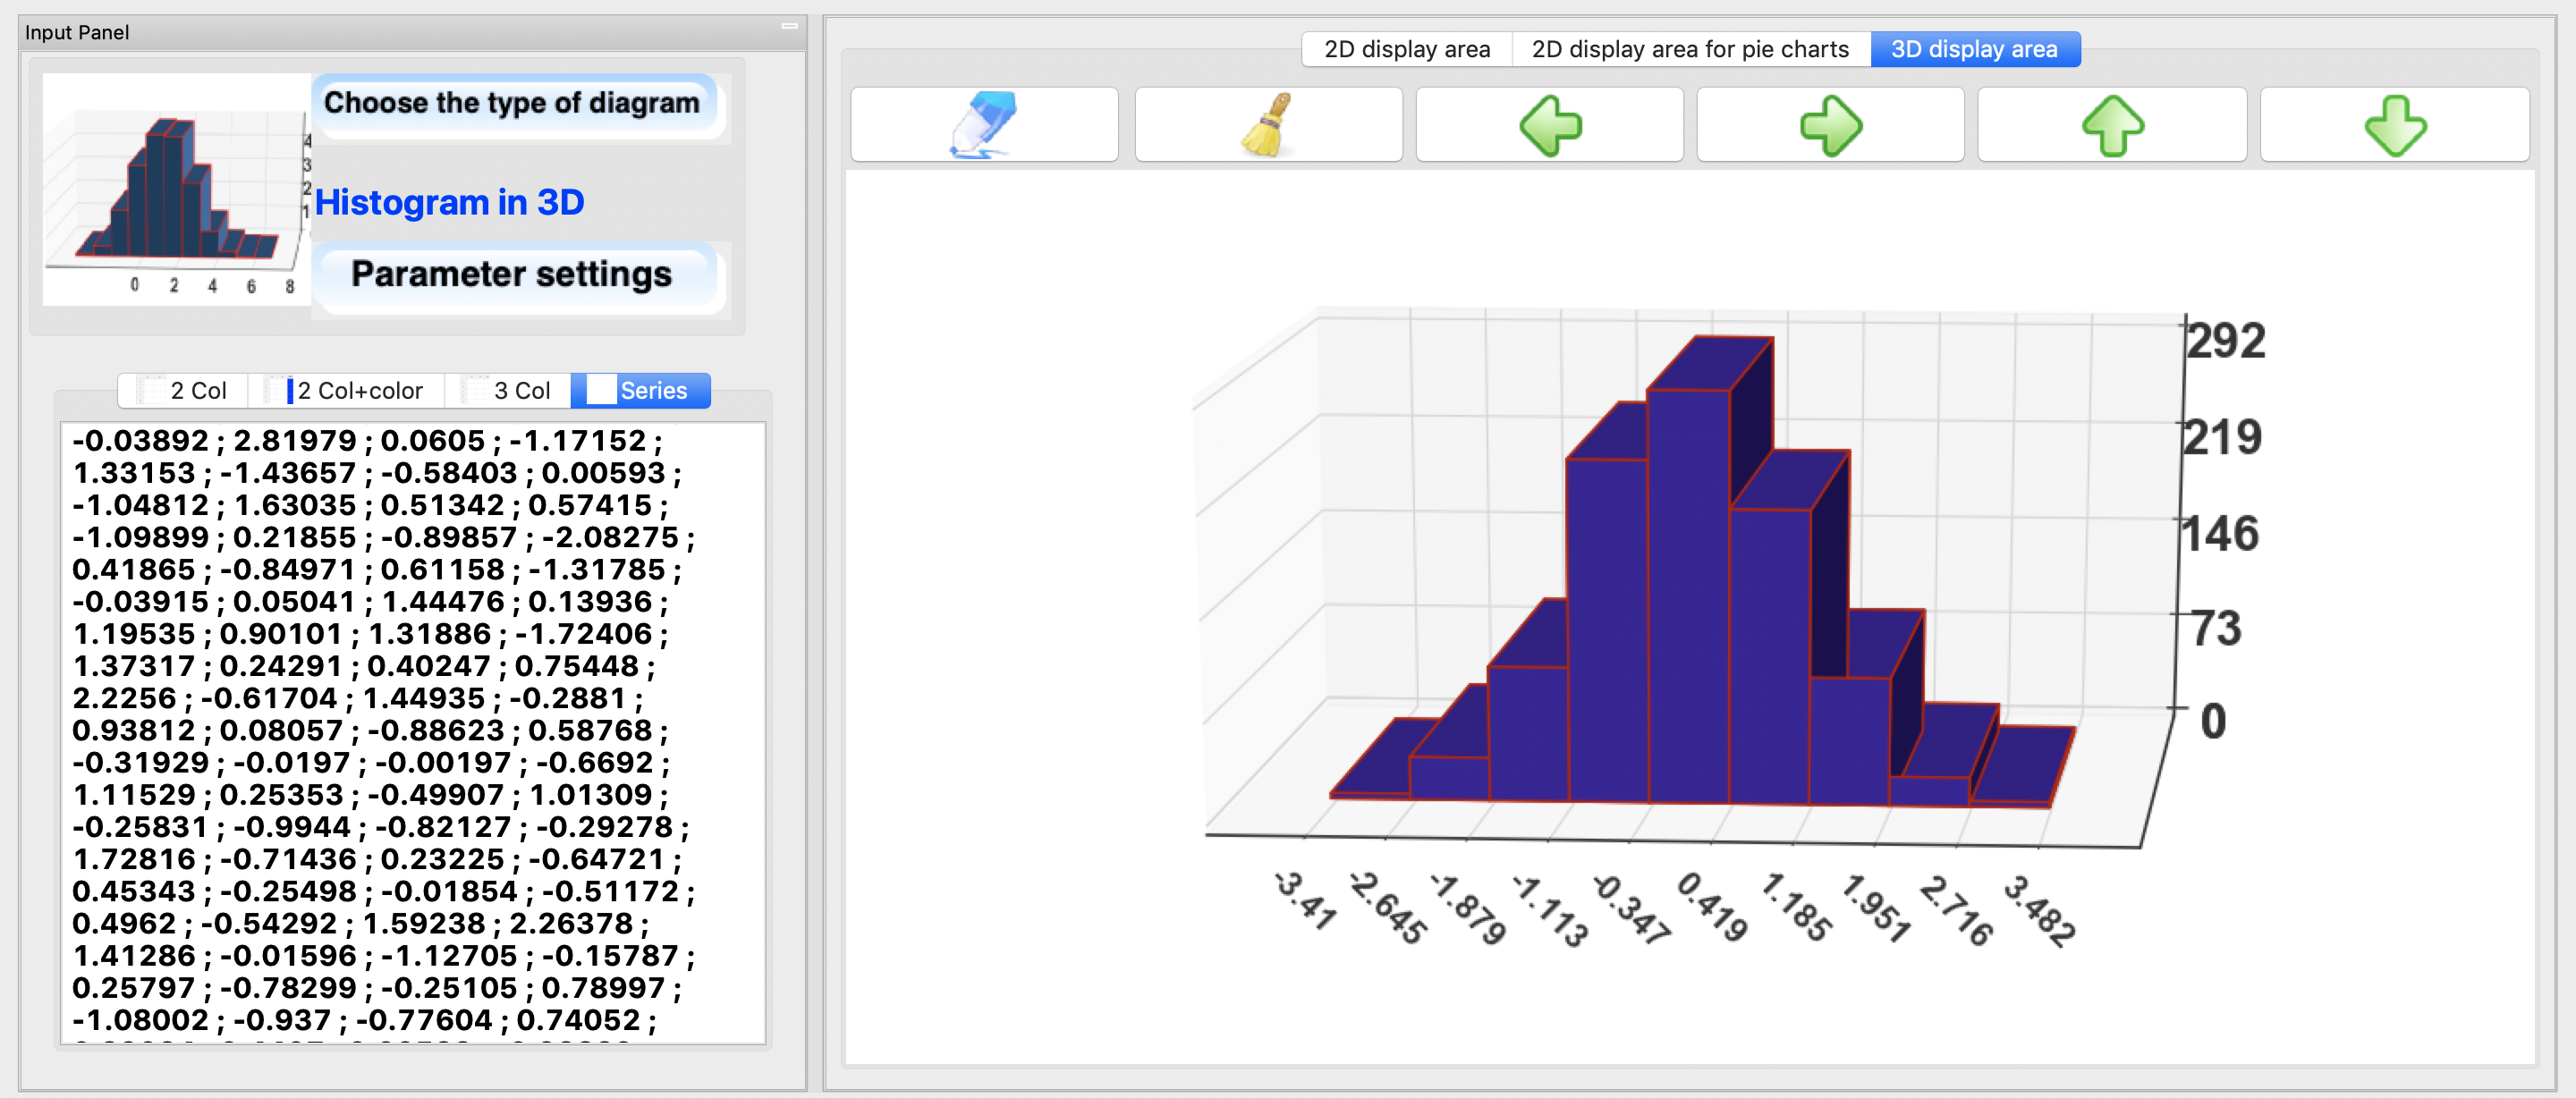
Three-dimensional bar charts
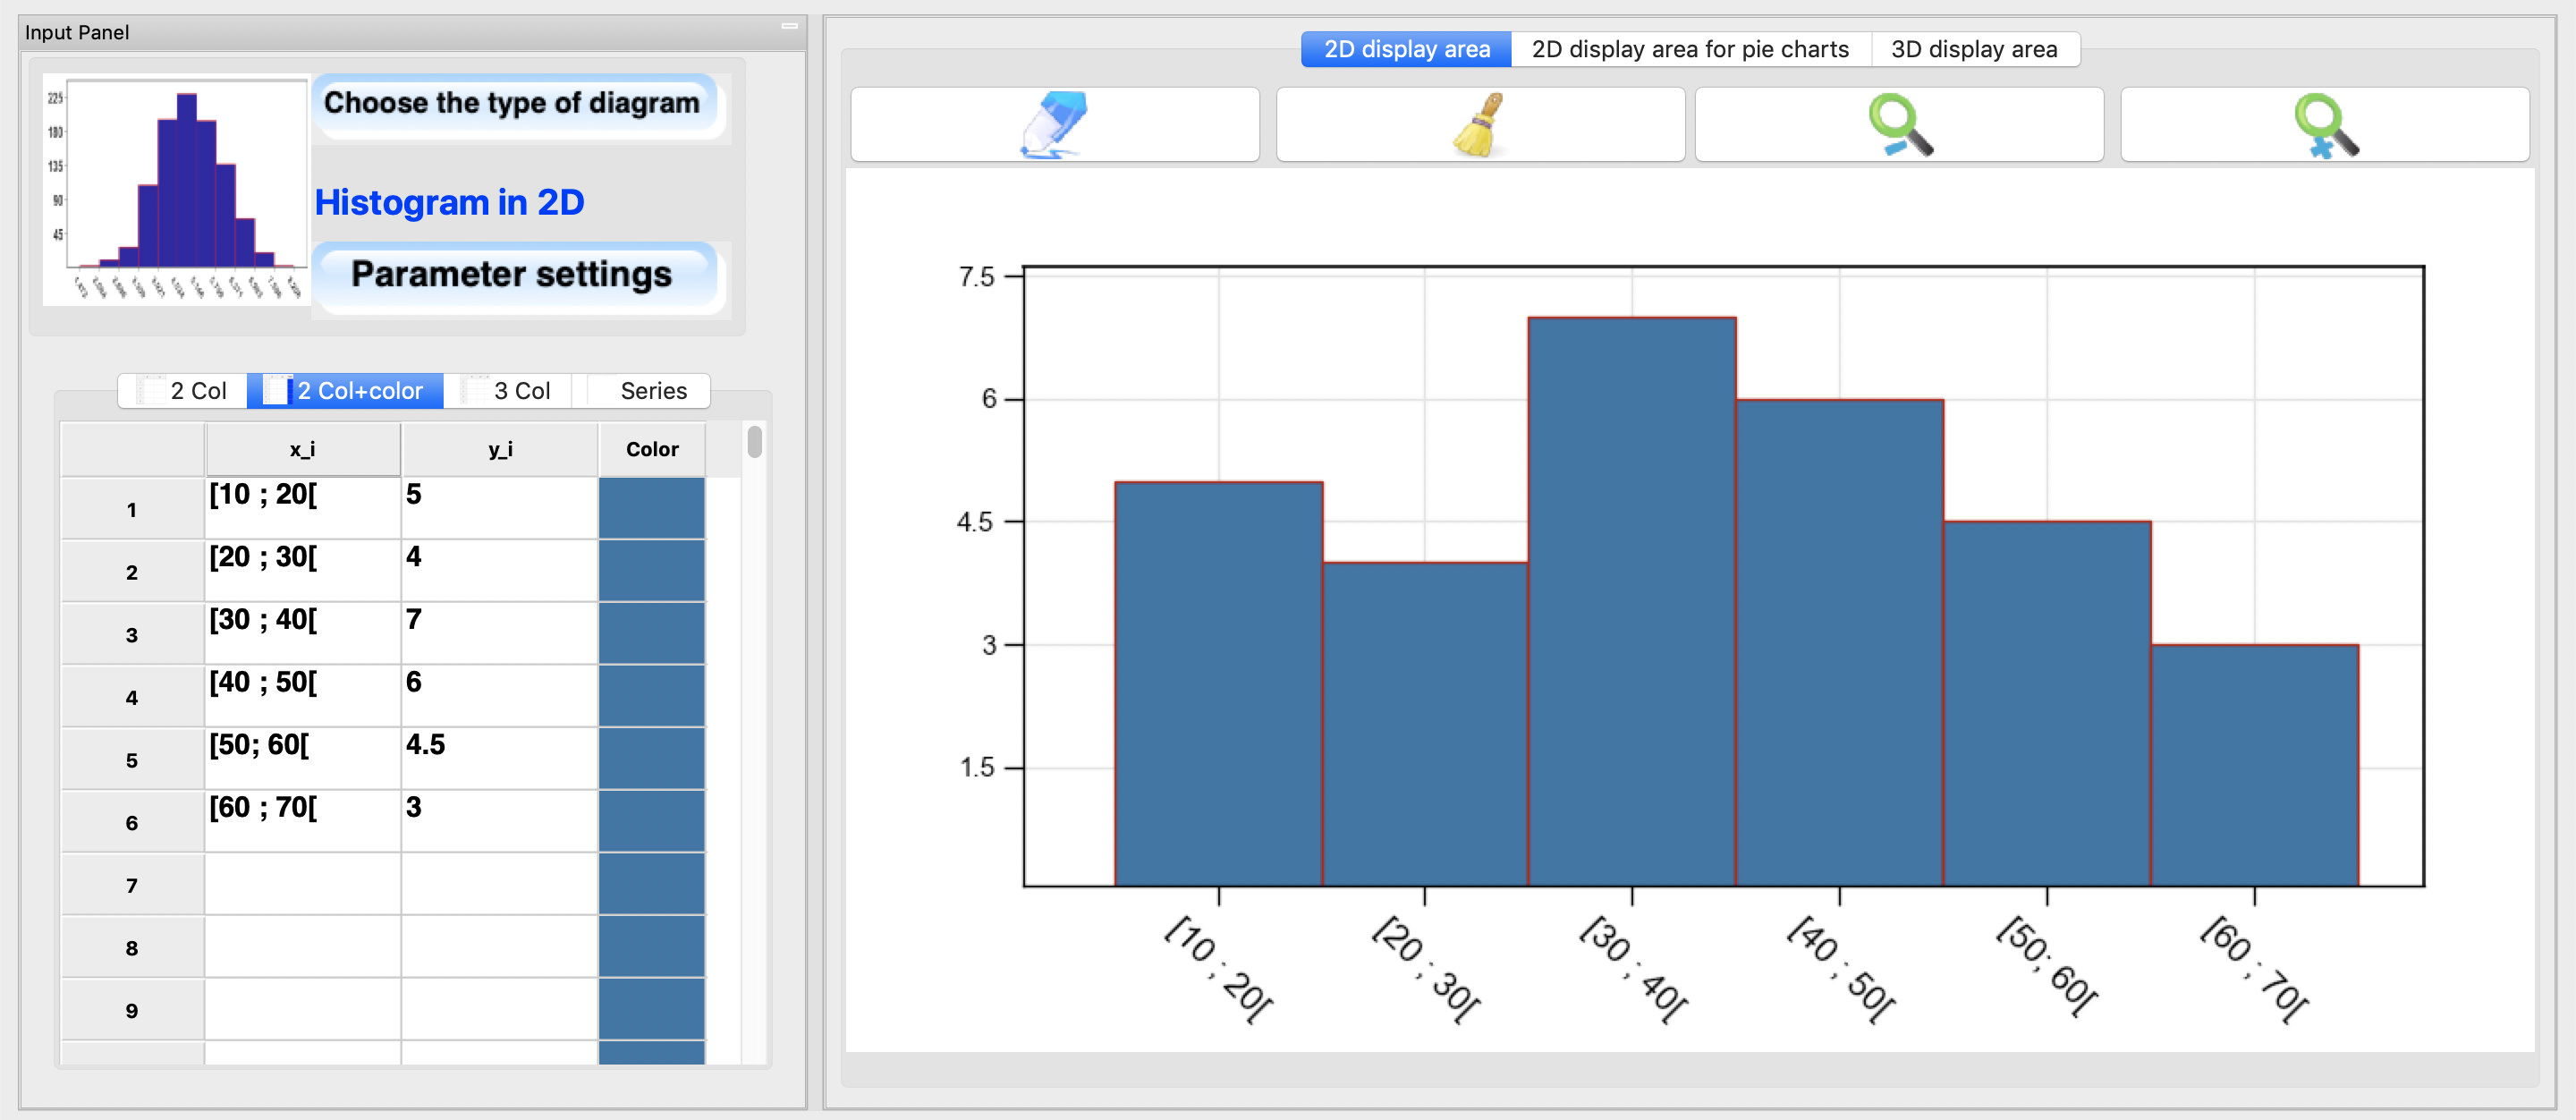
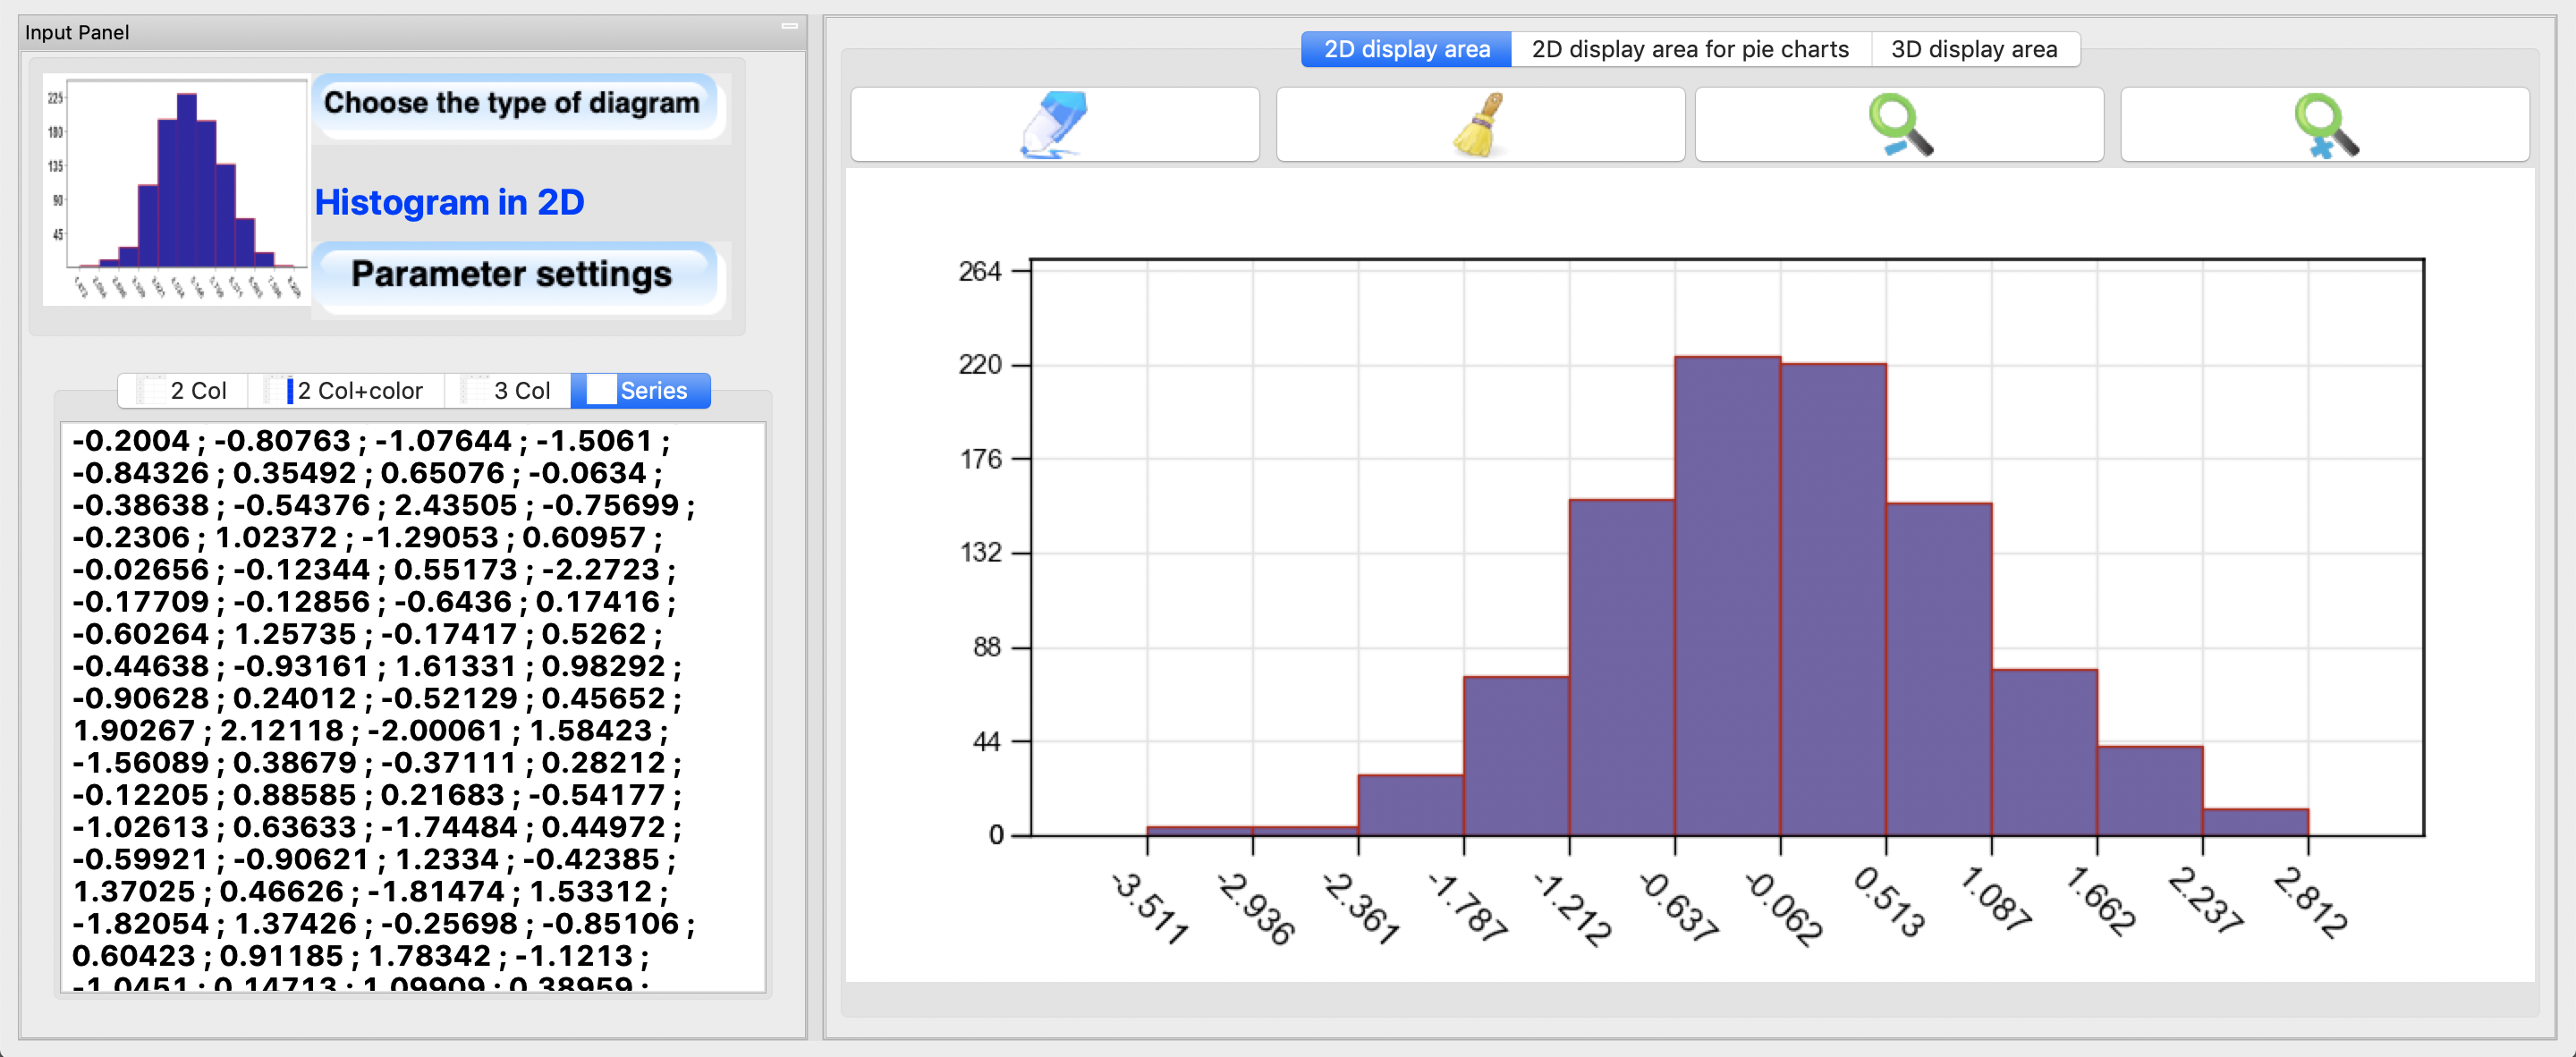
Histograms
Two-dimensional histogram
Three-dimensional histogram
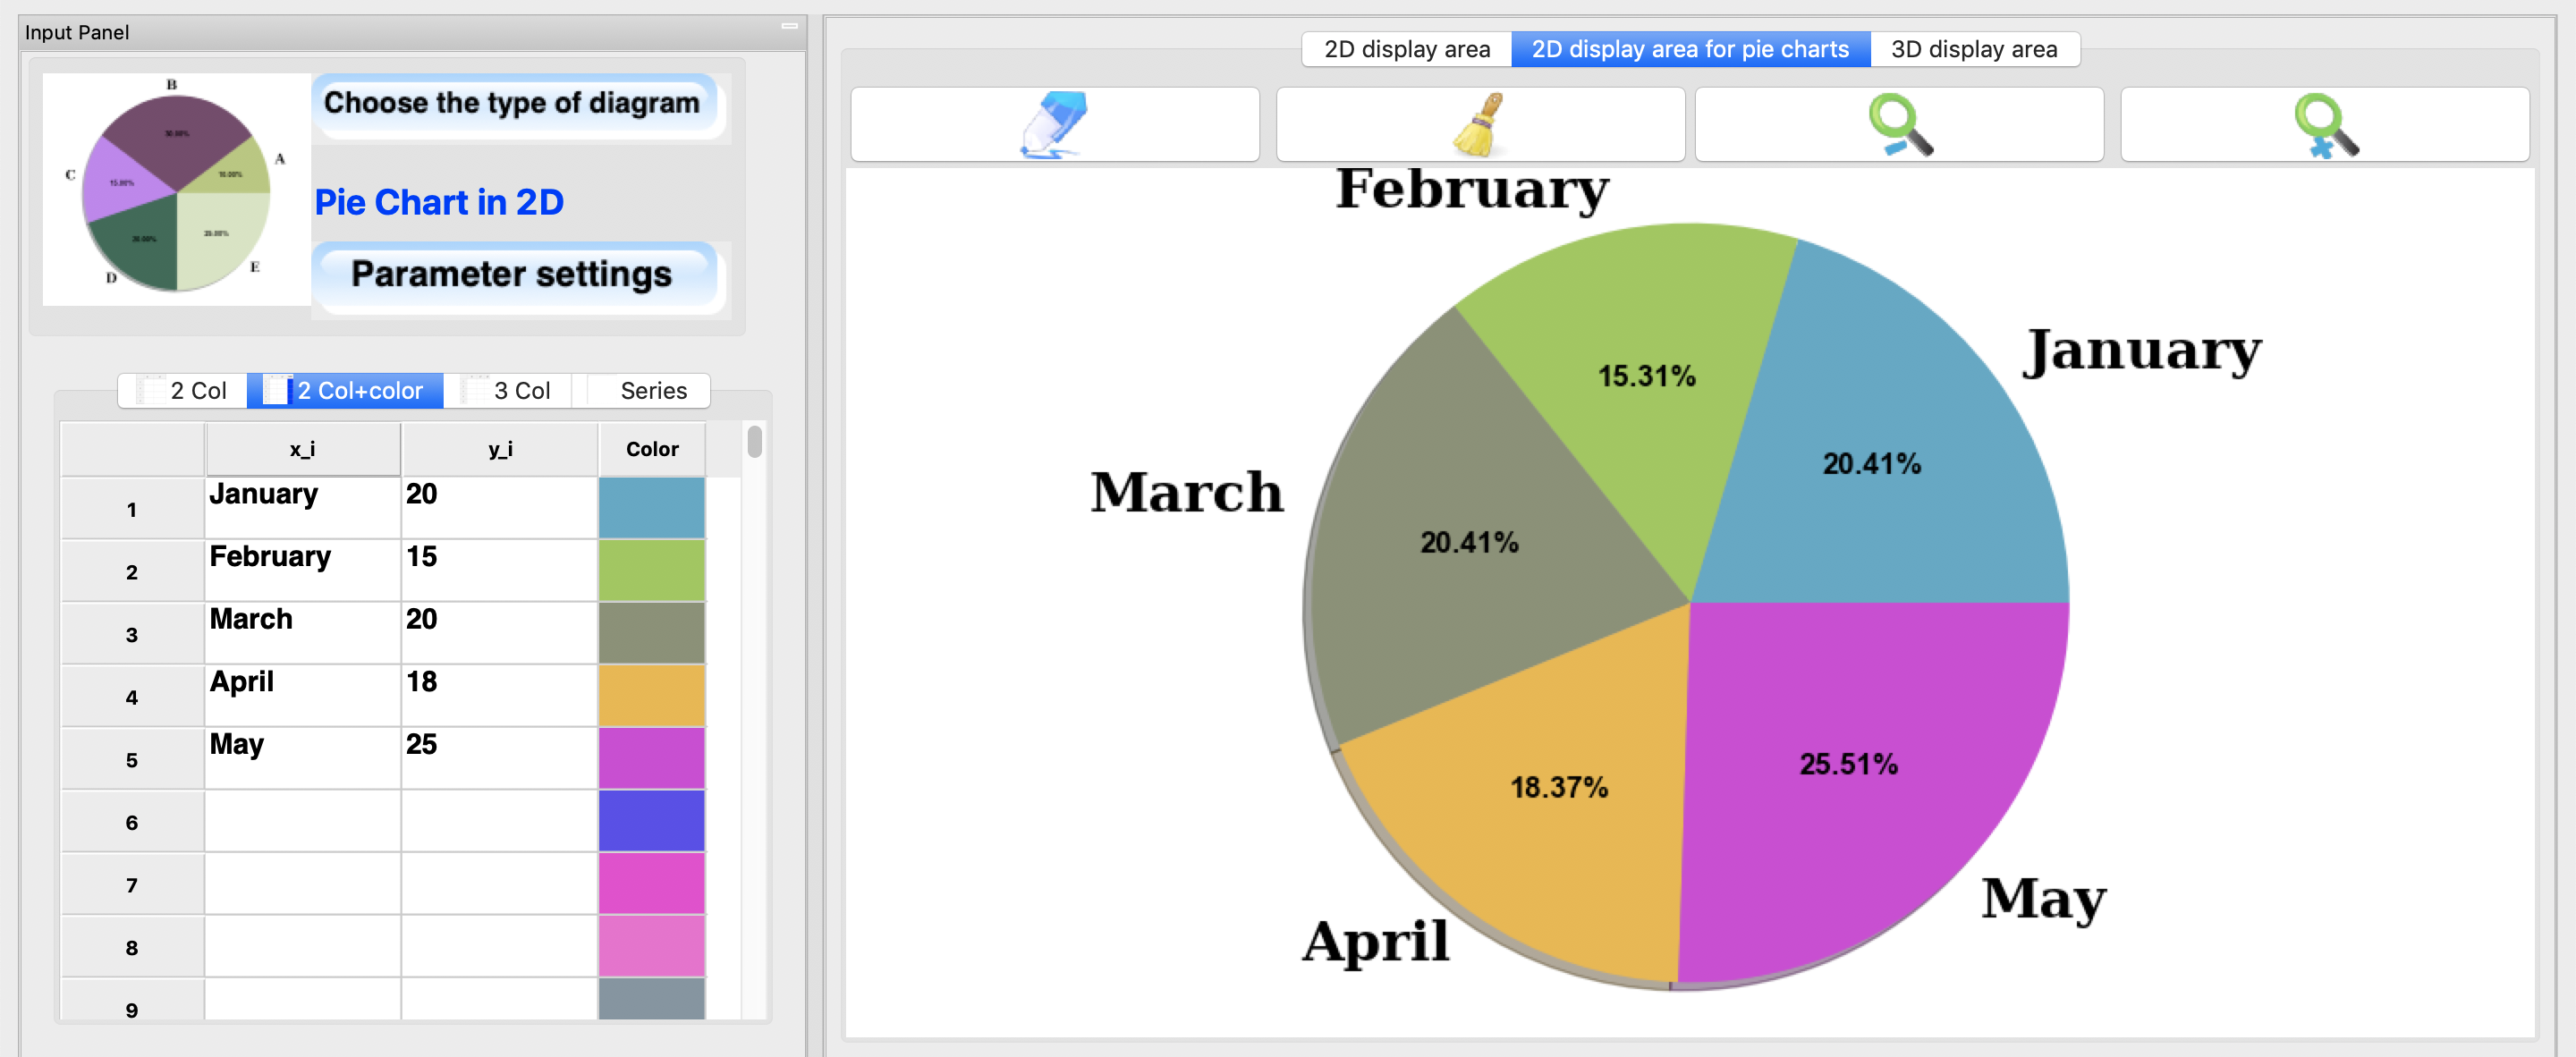
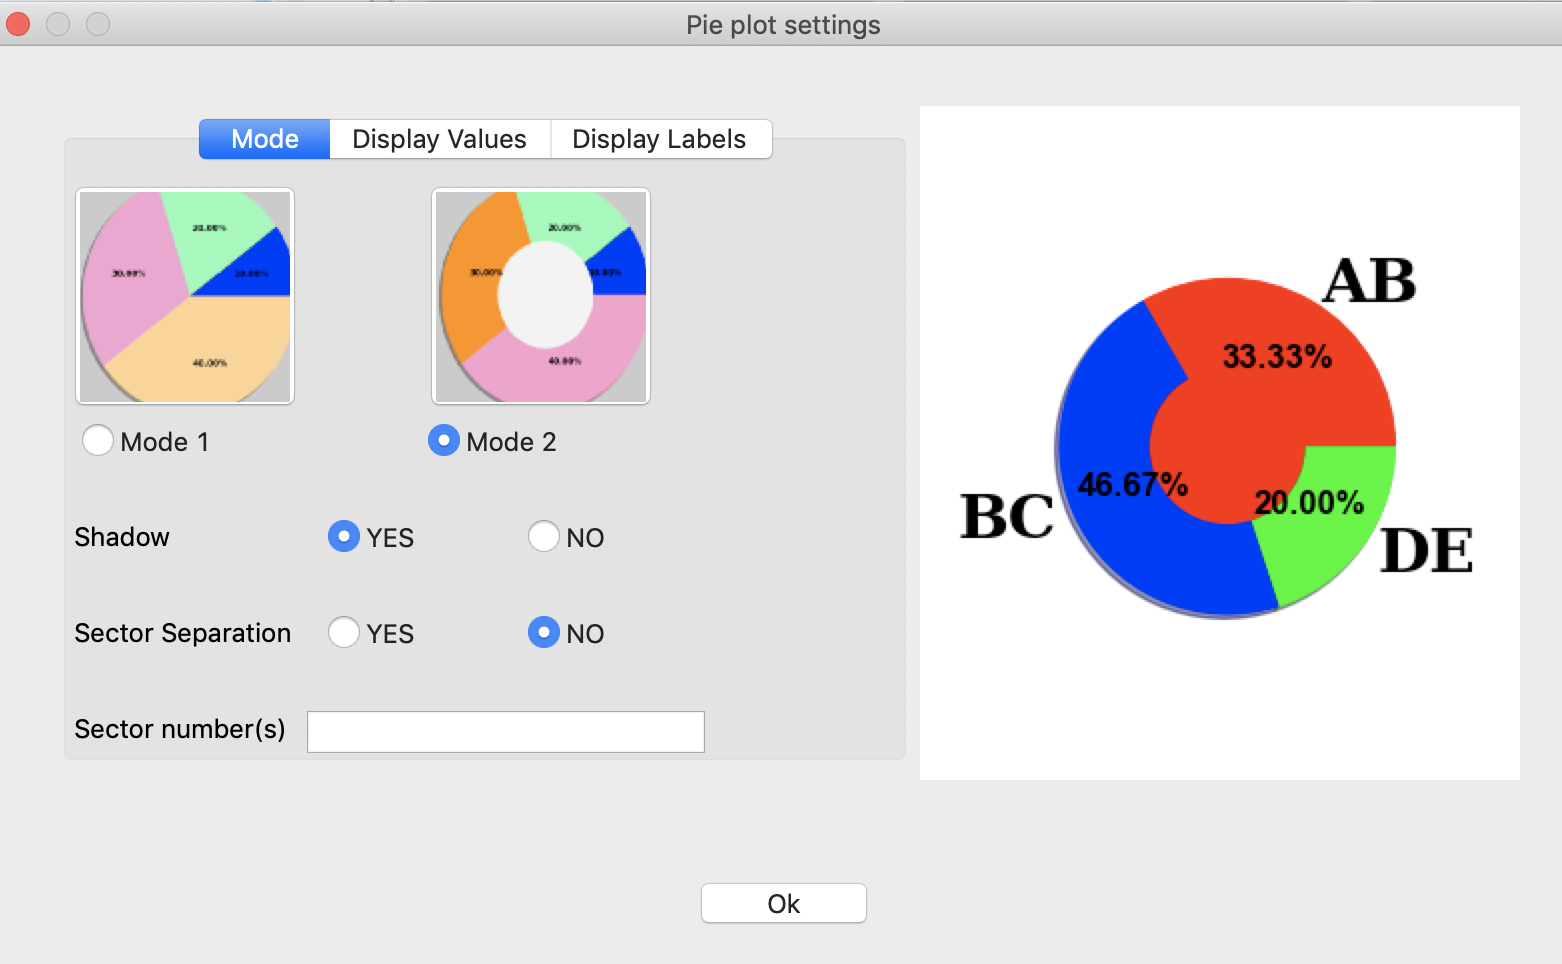
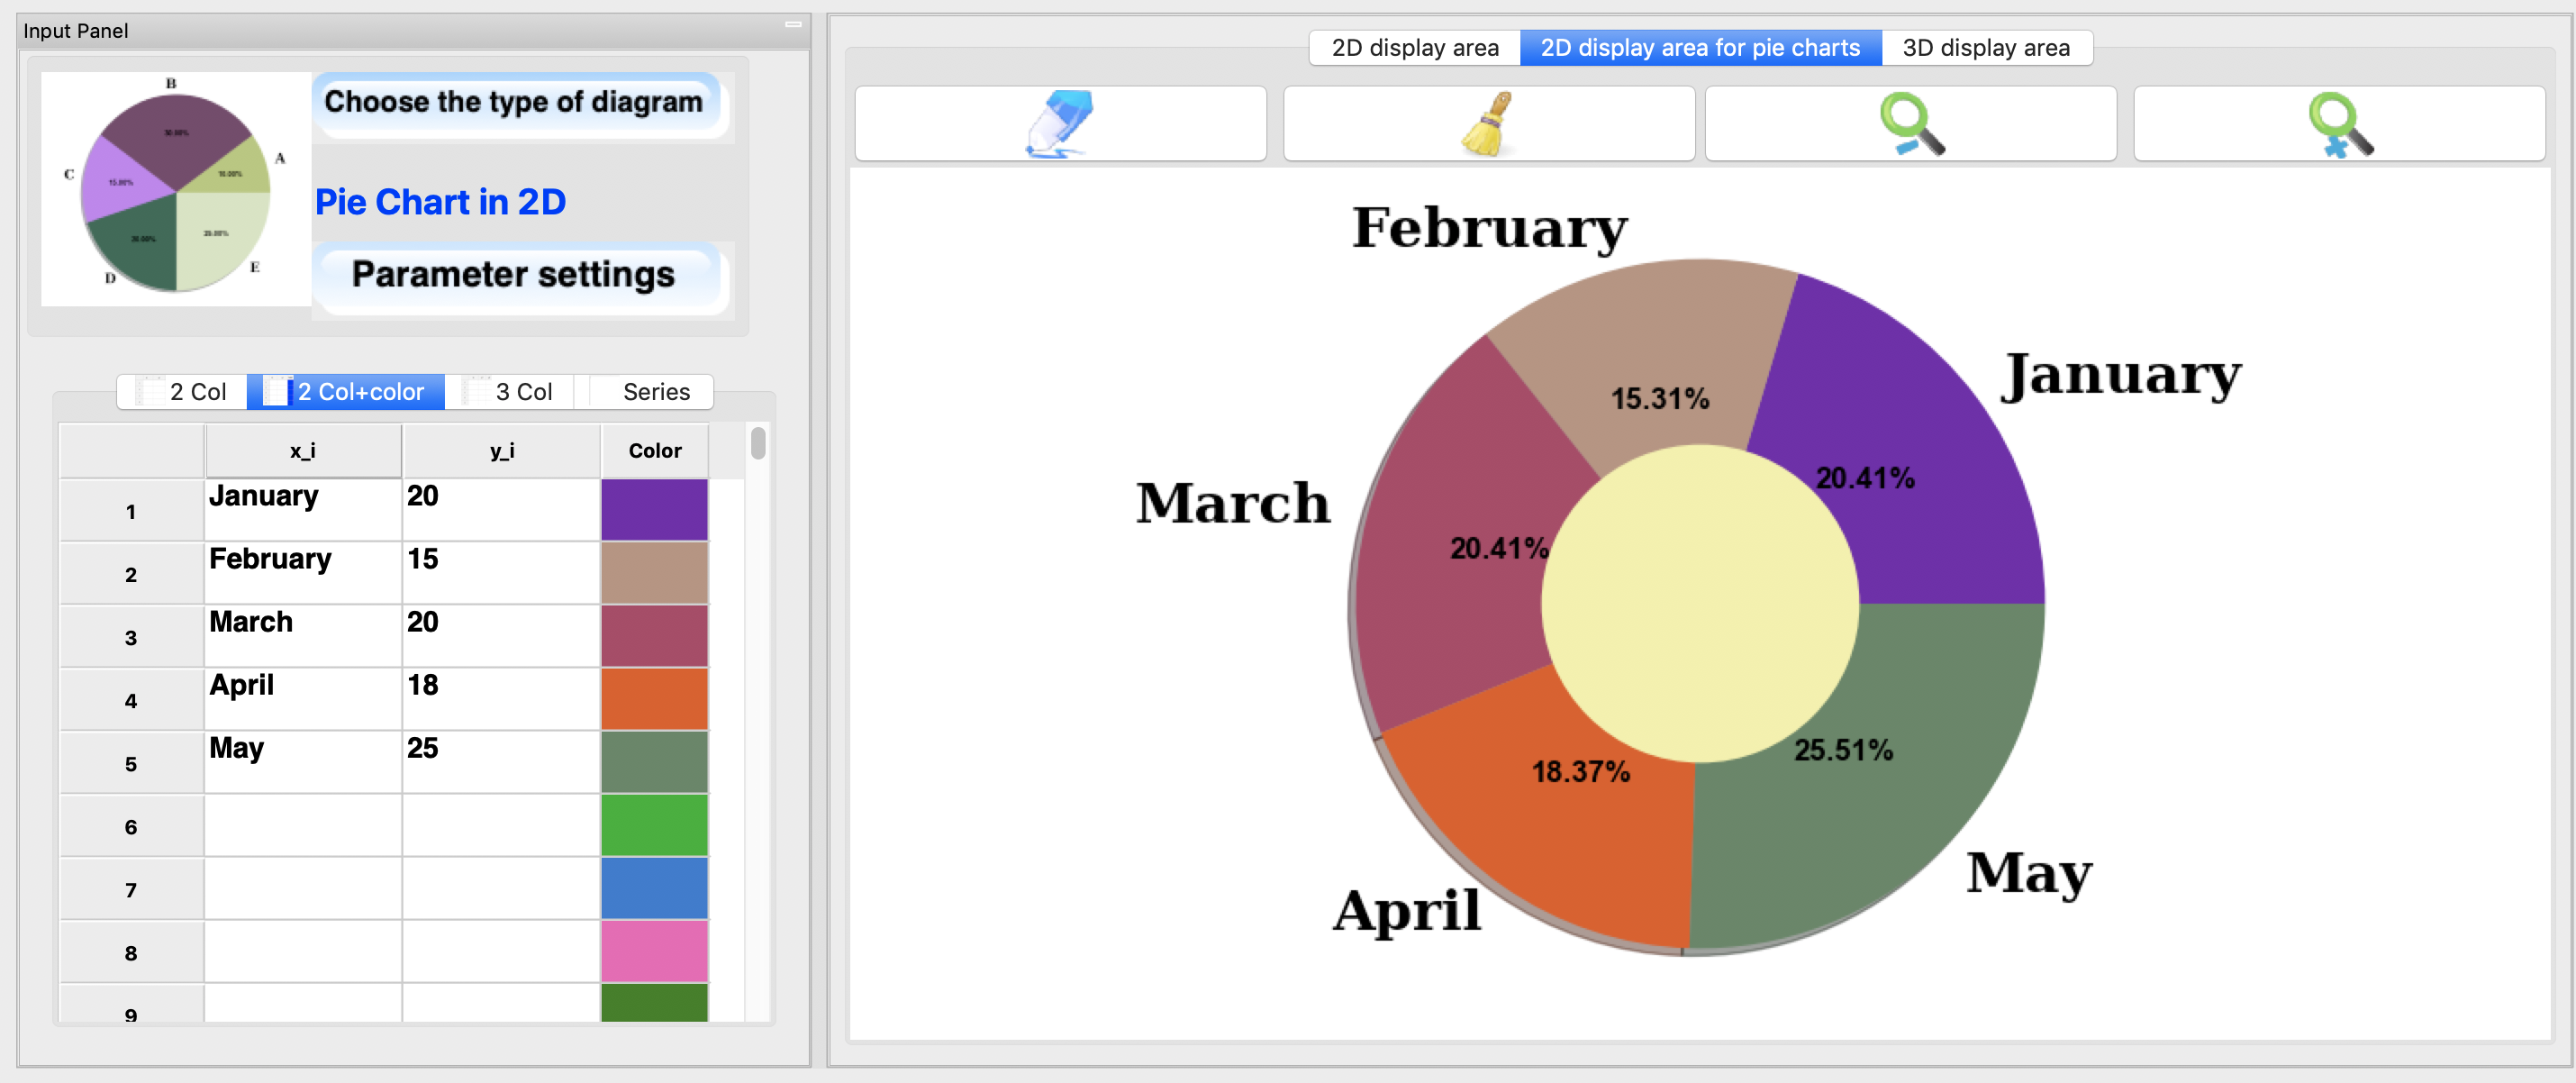
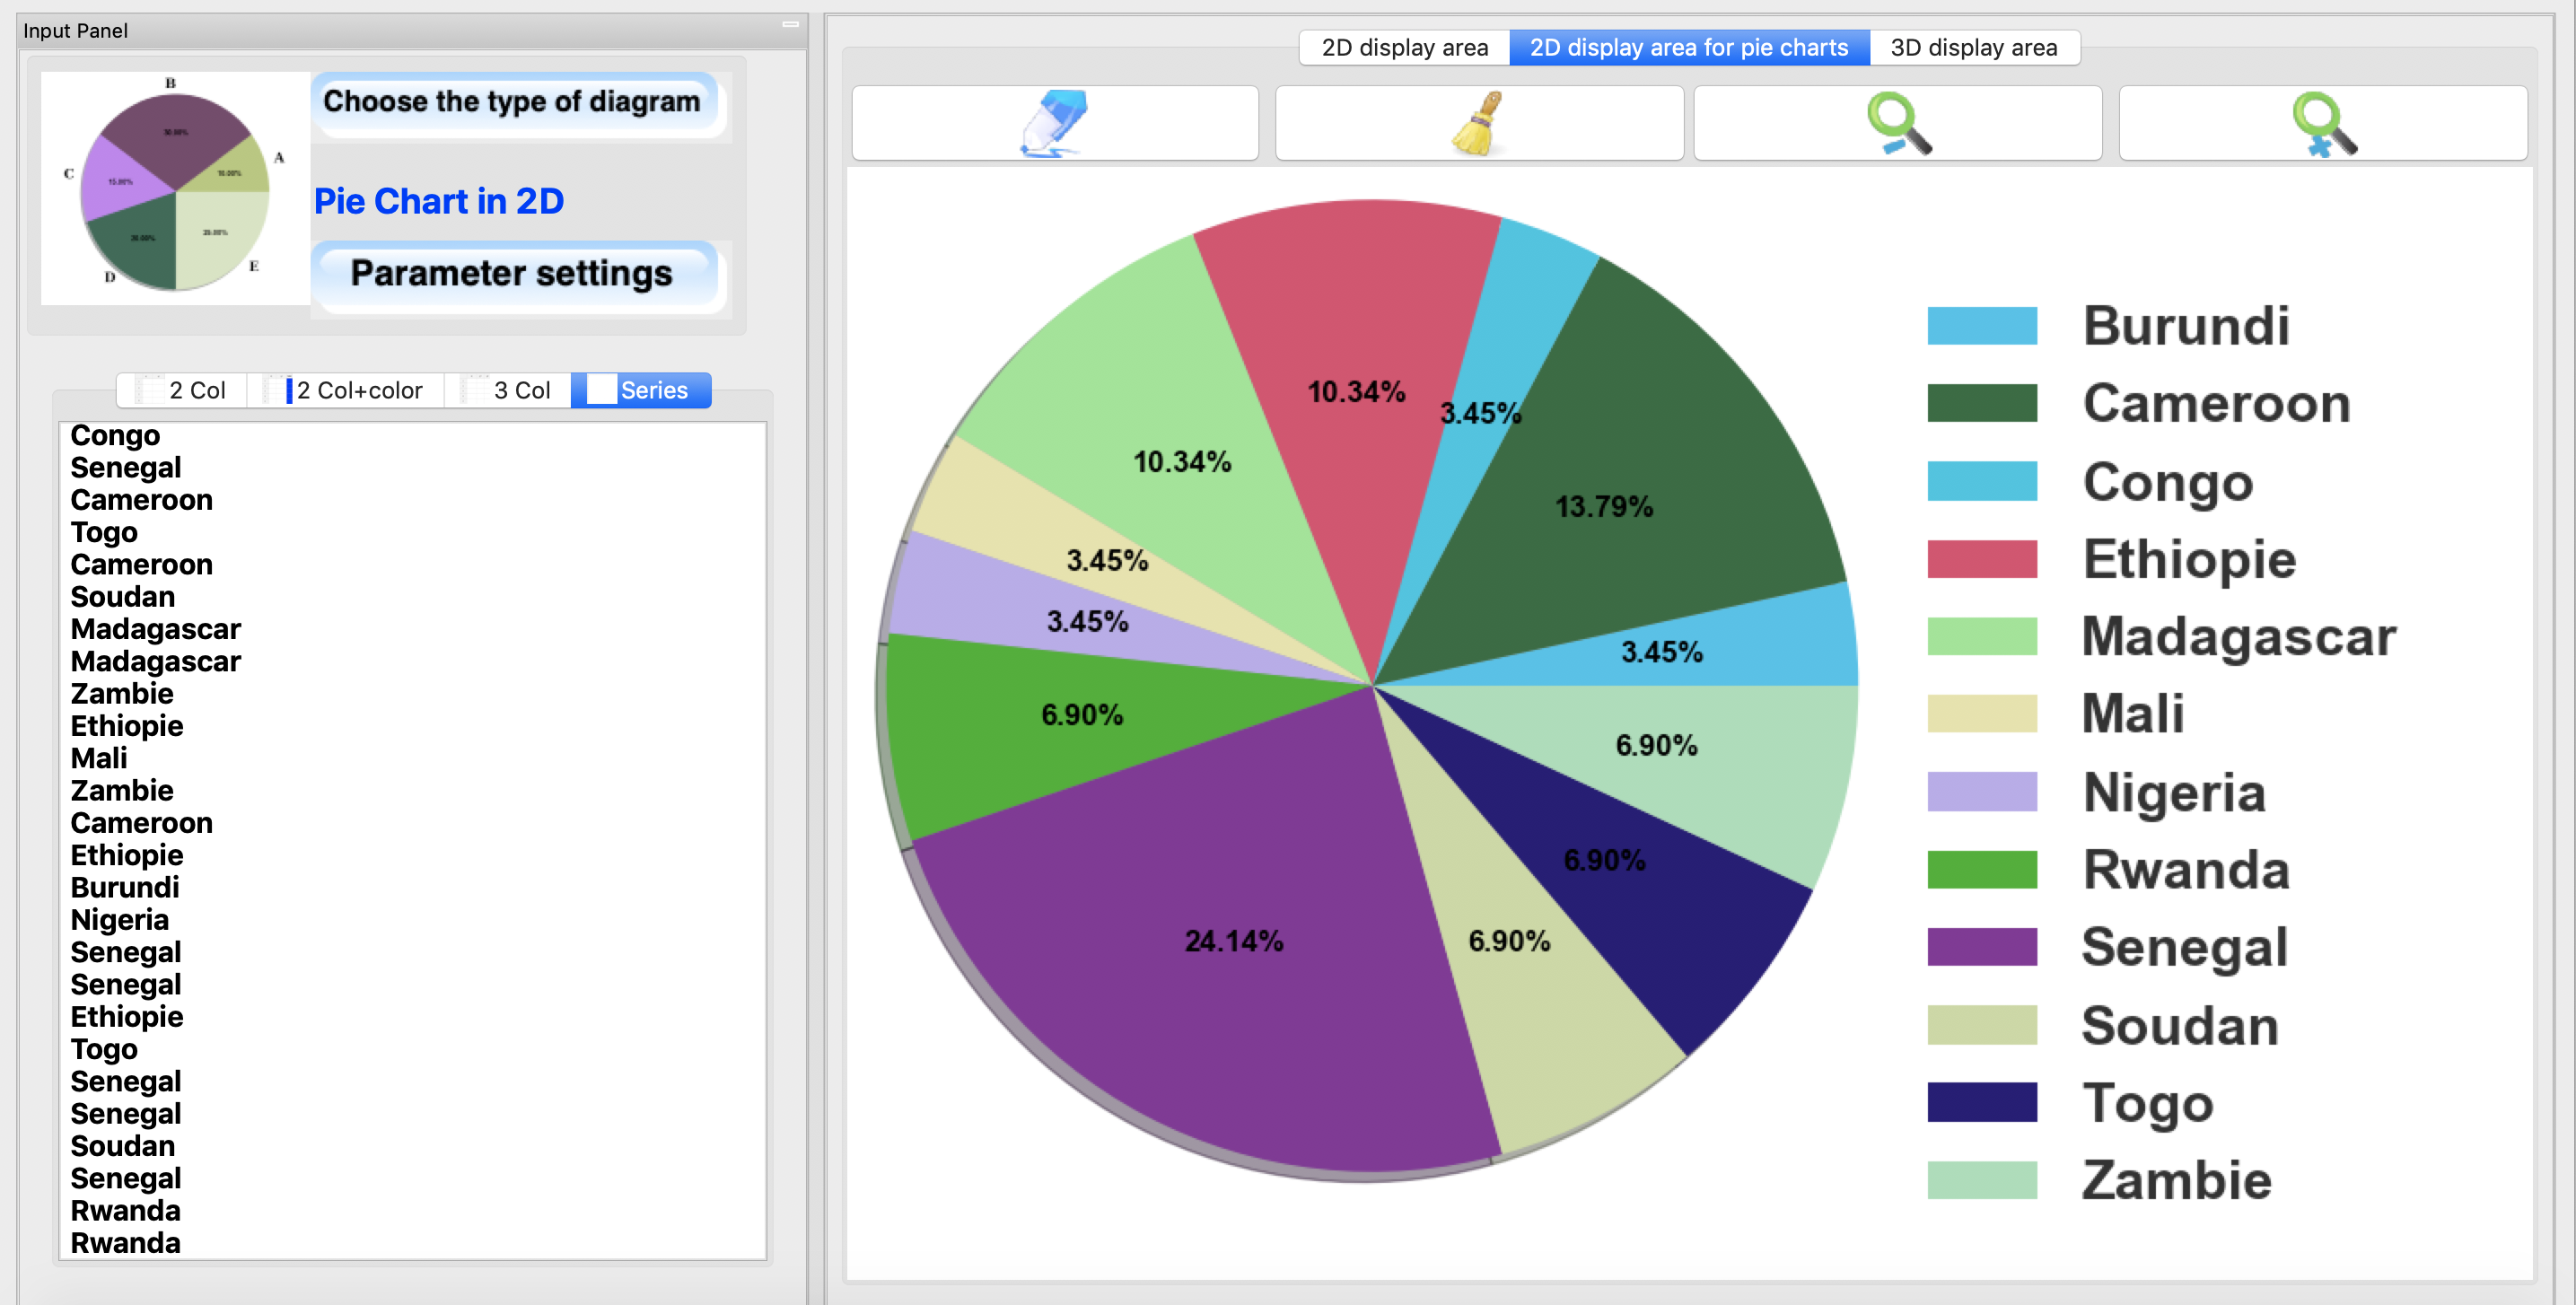
Pie charts
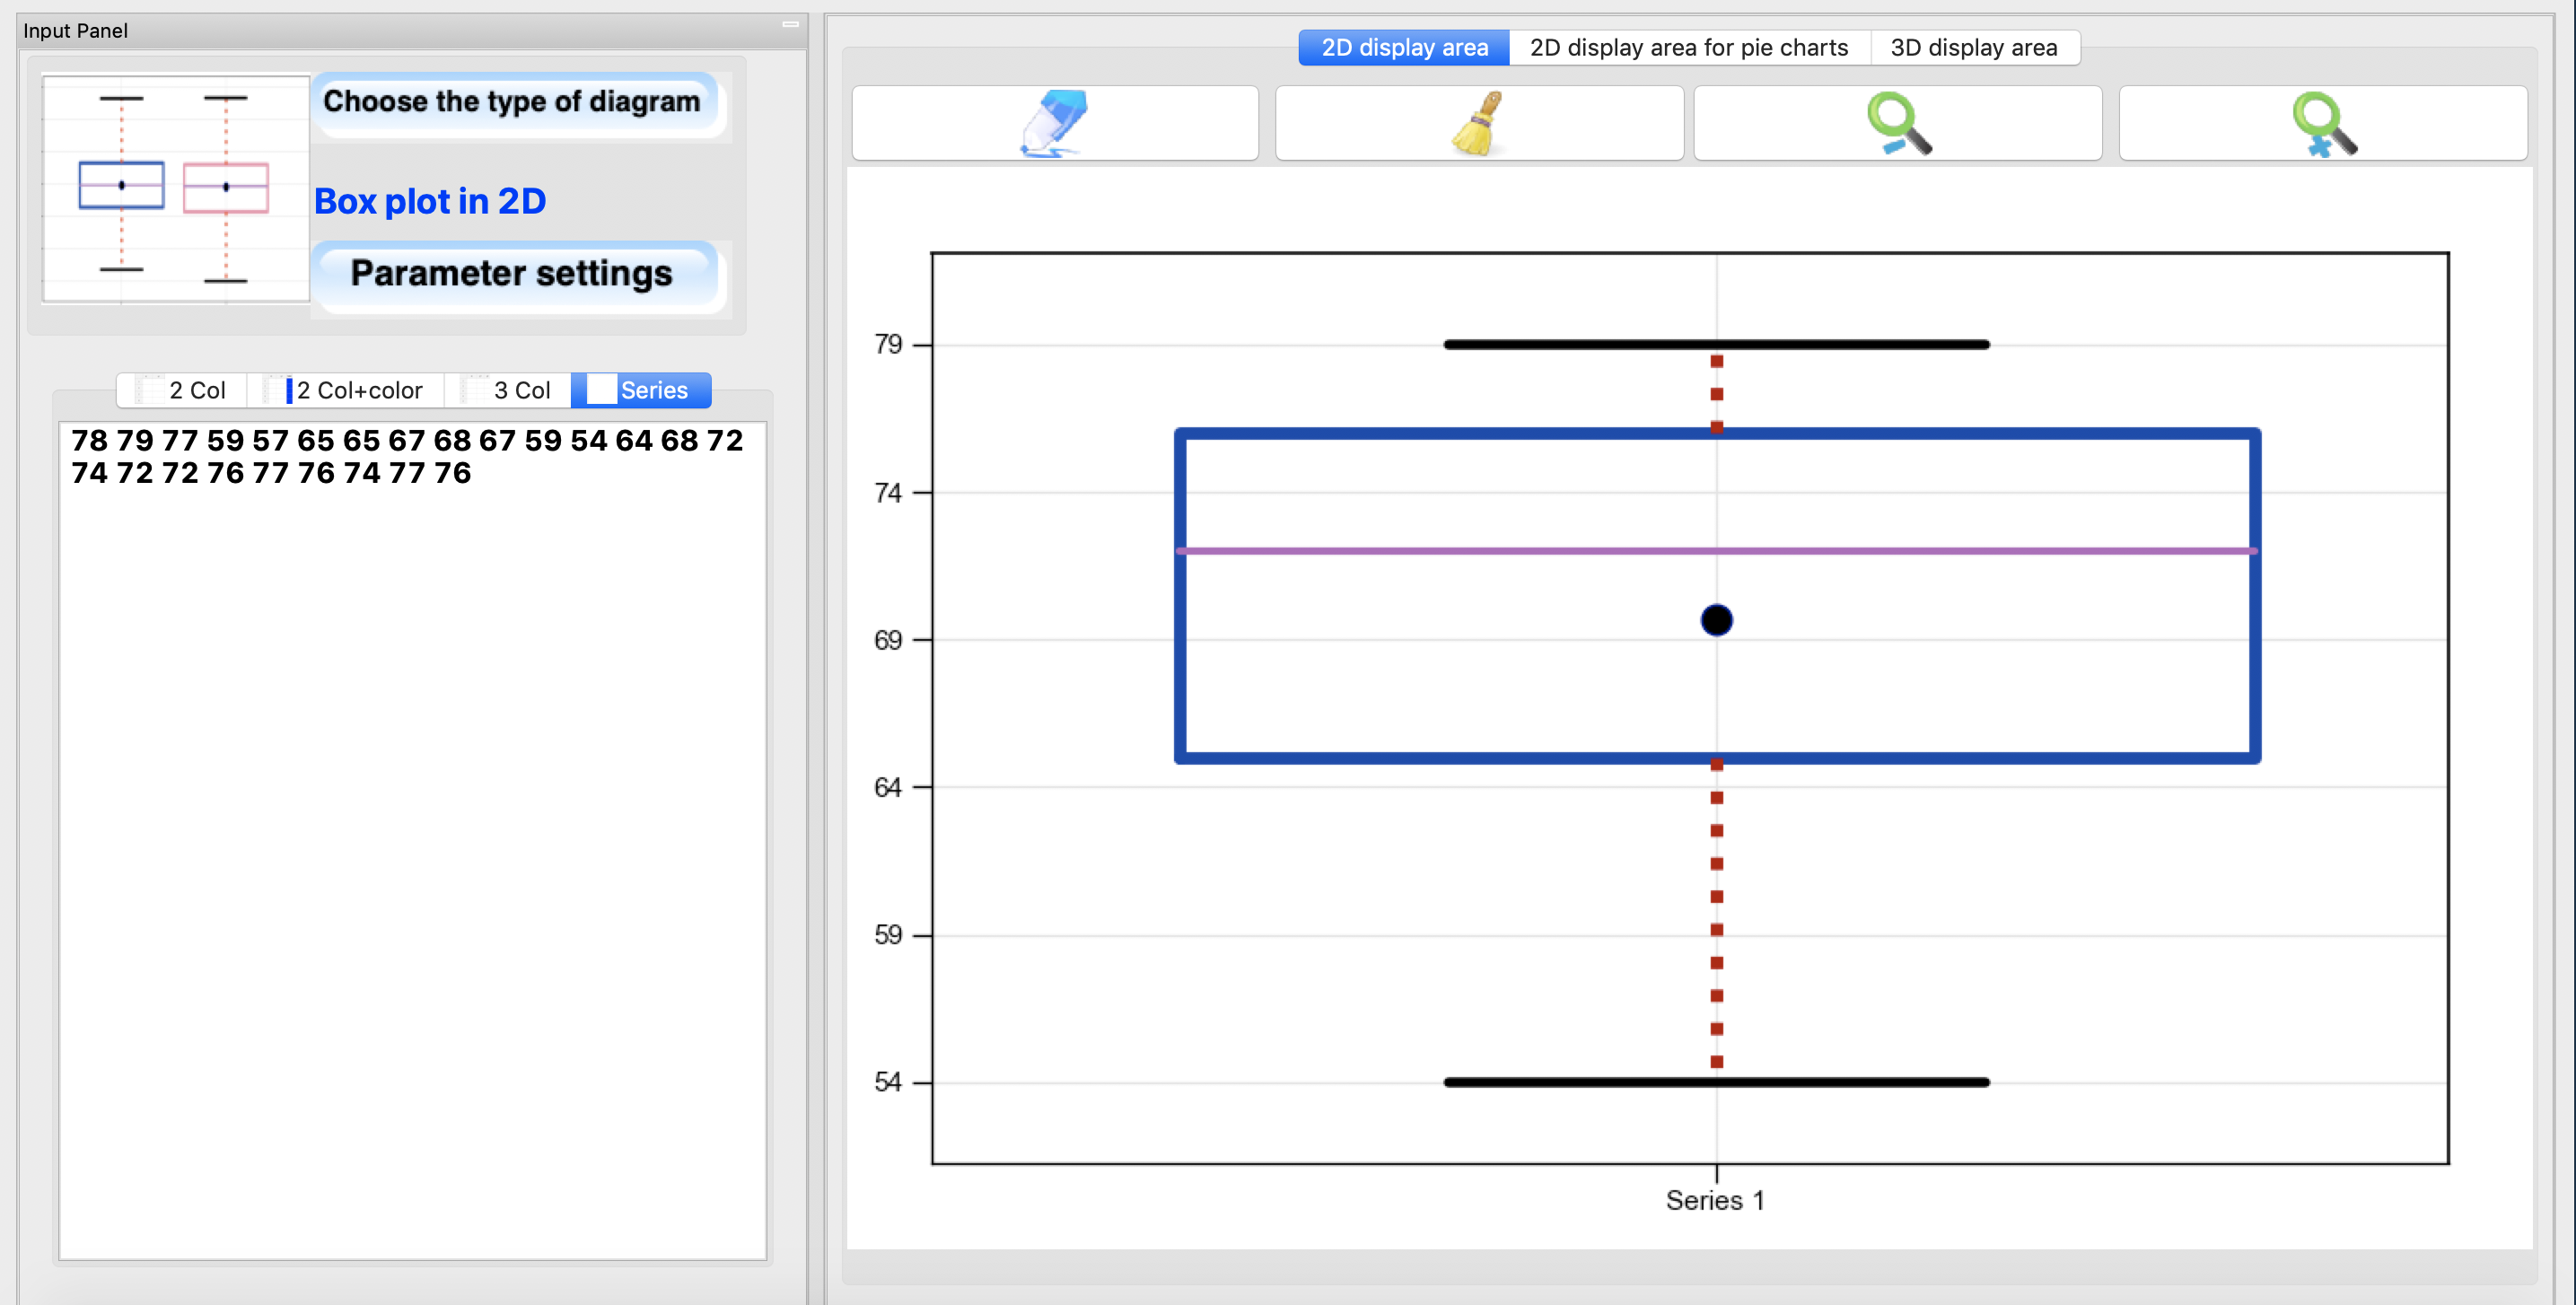
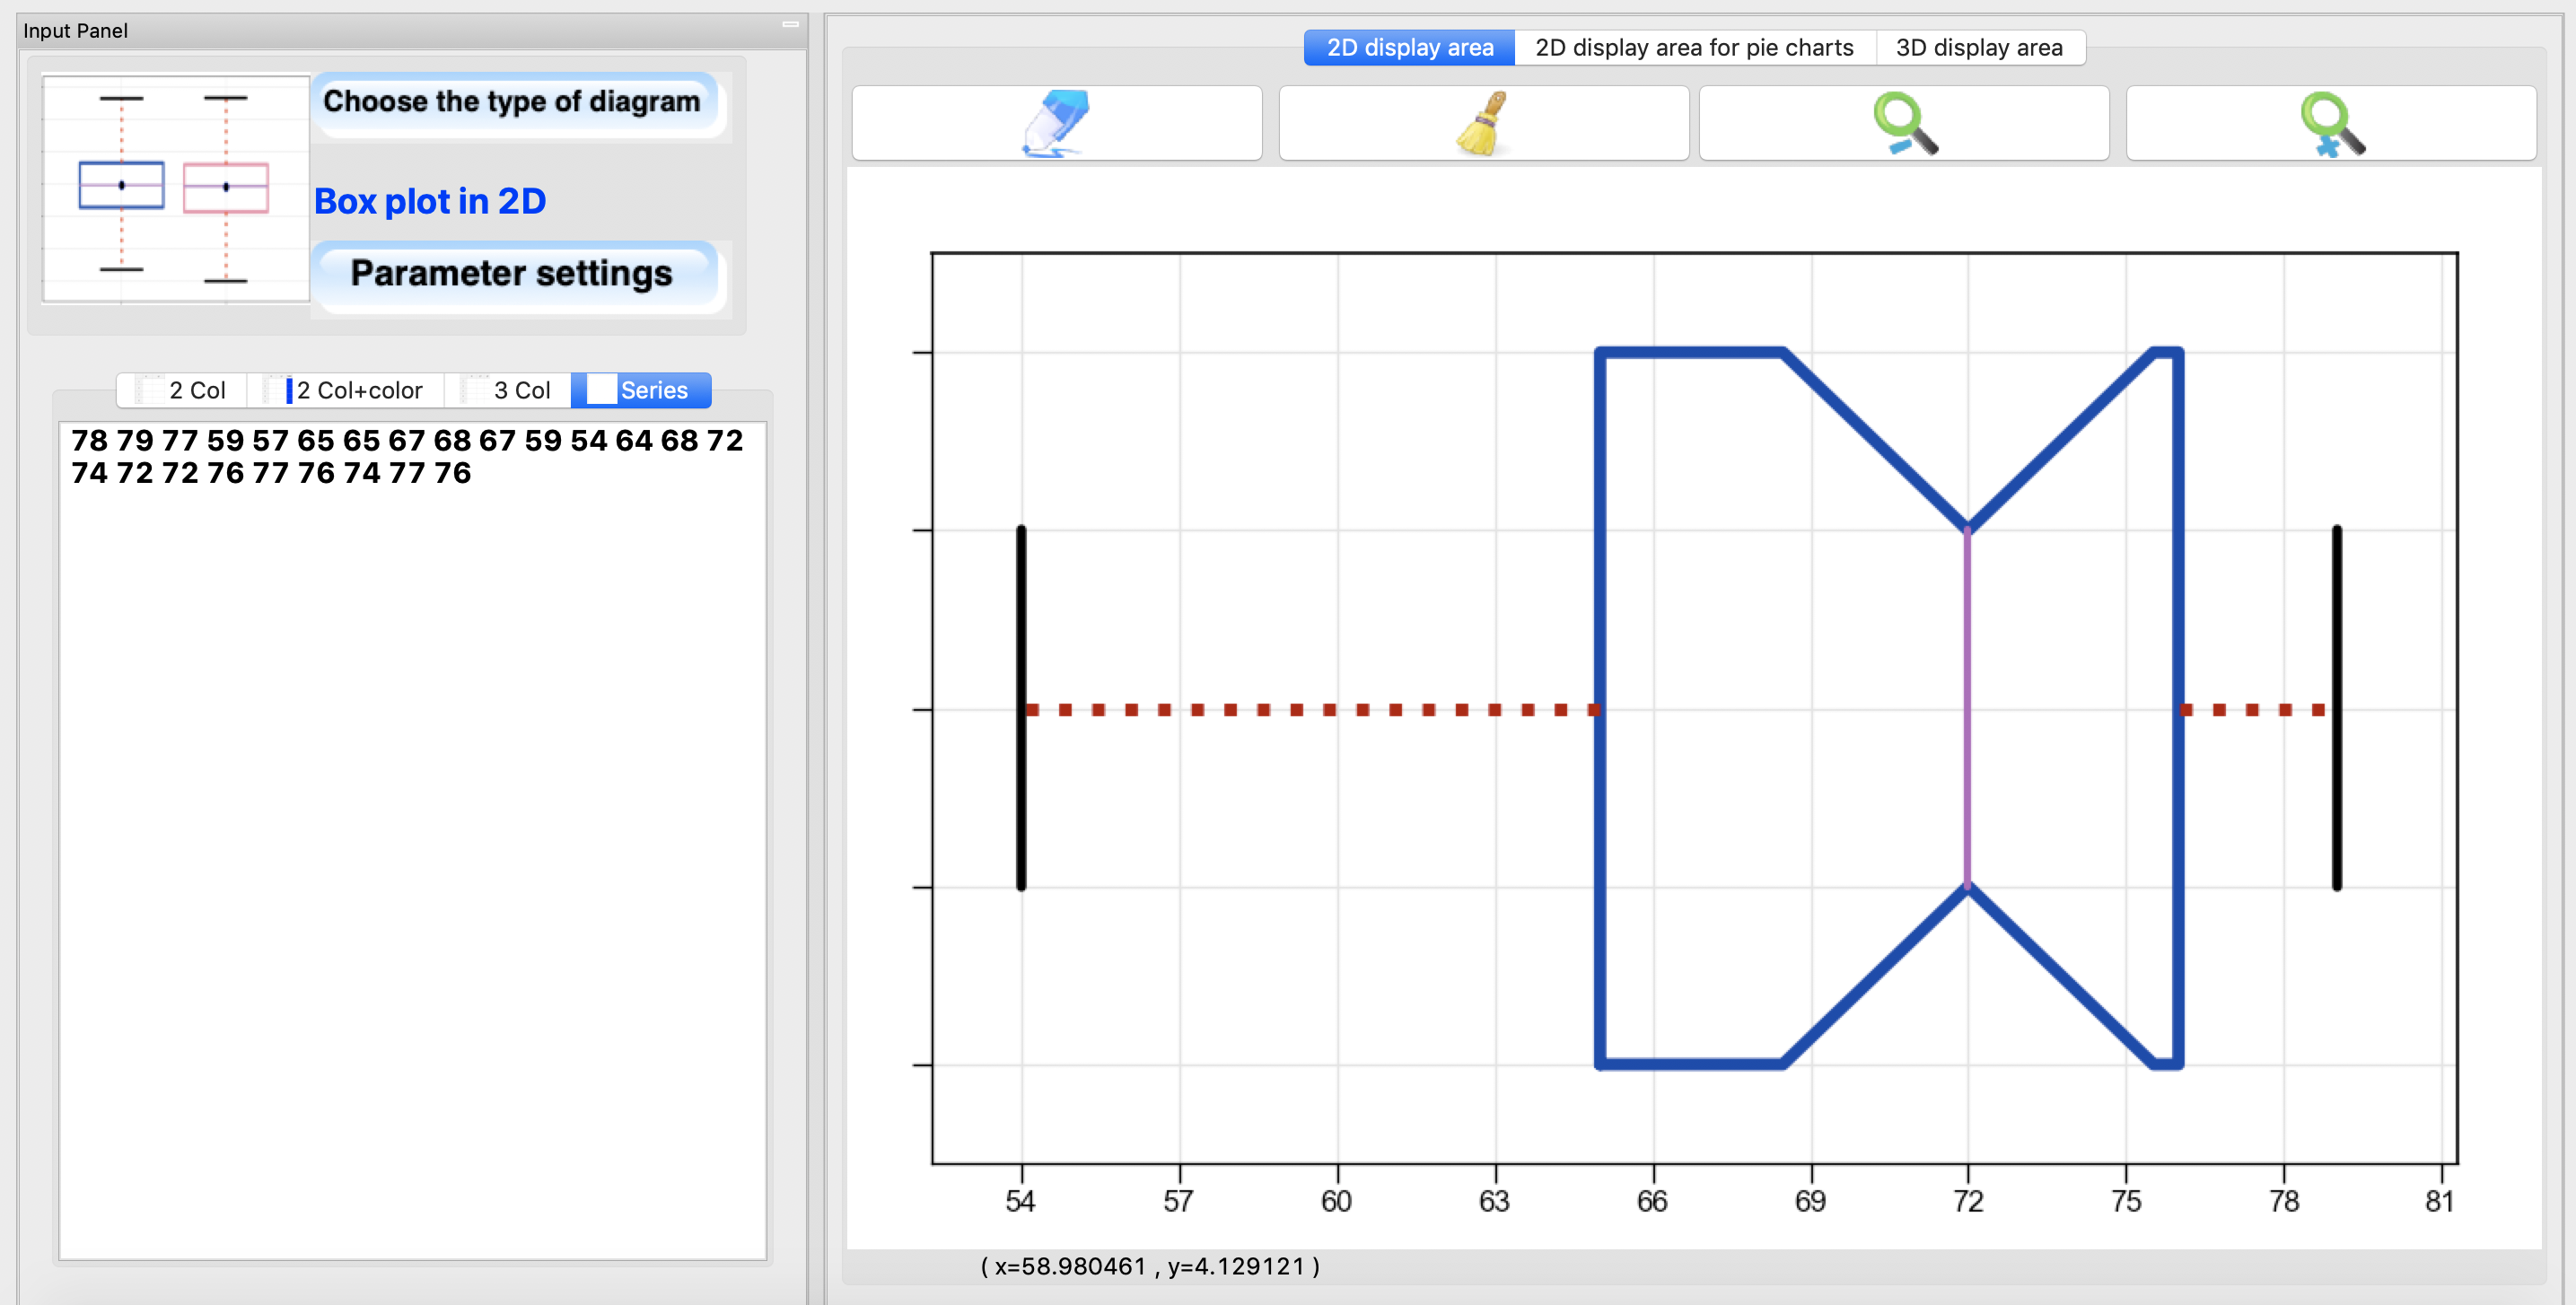
Box diagram
The grades of 24 students in a class were recorded on a 100-point exam.
78 79 77 59 57 65 65 67 68 67 59 54 64 68 72 74 72 72 76 77 76 74 77 76
Let’s draw the whisker box for this statistical series.
We can also change the alignment and properties of the box.
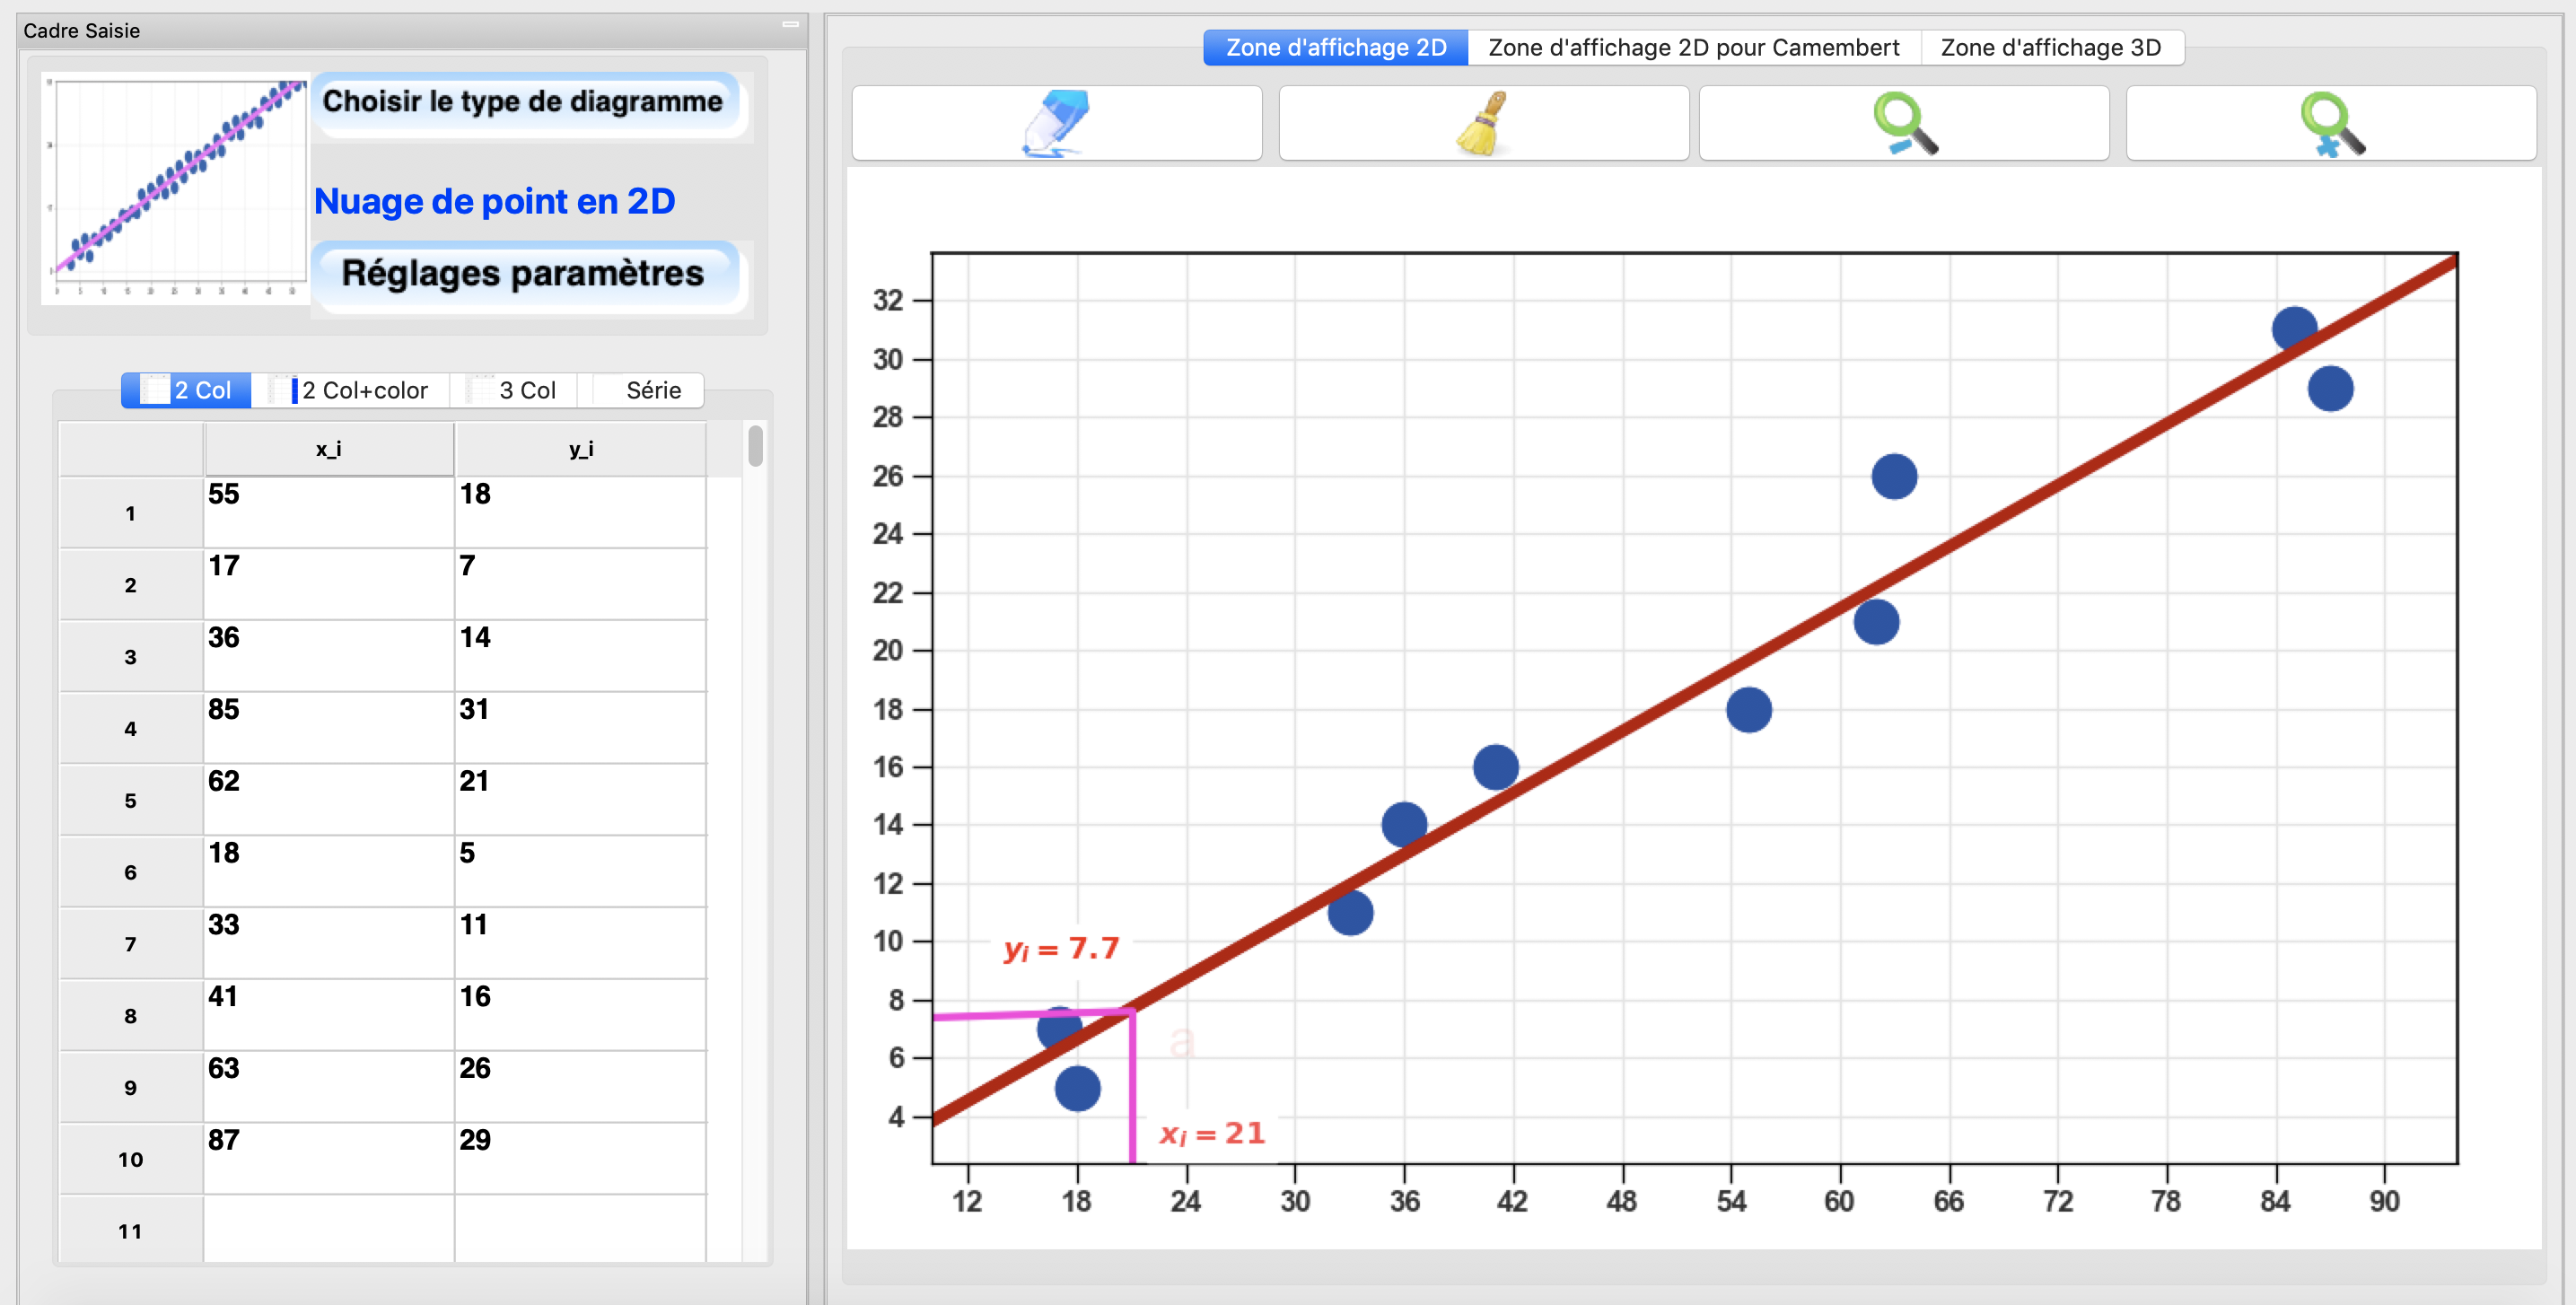
Scatter plot
We give the following pairs of observations
\(x_i\) |
55 |
17 |
36 |
85 |
62 |
18 |
33 |
41 |
63 |
87 |
|---|---|---|---|---|---|---|---|---|---|---|
\(y_i\) |
18 |
7 |
14 |
31 |
21 |
5 |
11 |
16 |
26 |
29 |
Draw the scatter plot of the pairs \((x_i, y_i)\).
Determine the regression line for these observations.
What is a plausible estimate of y at \(x_i = 21\).
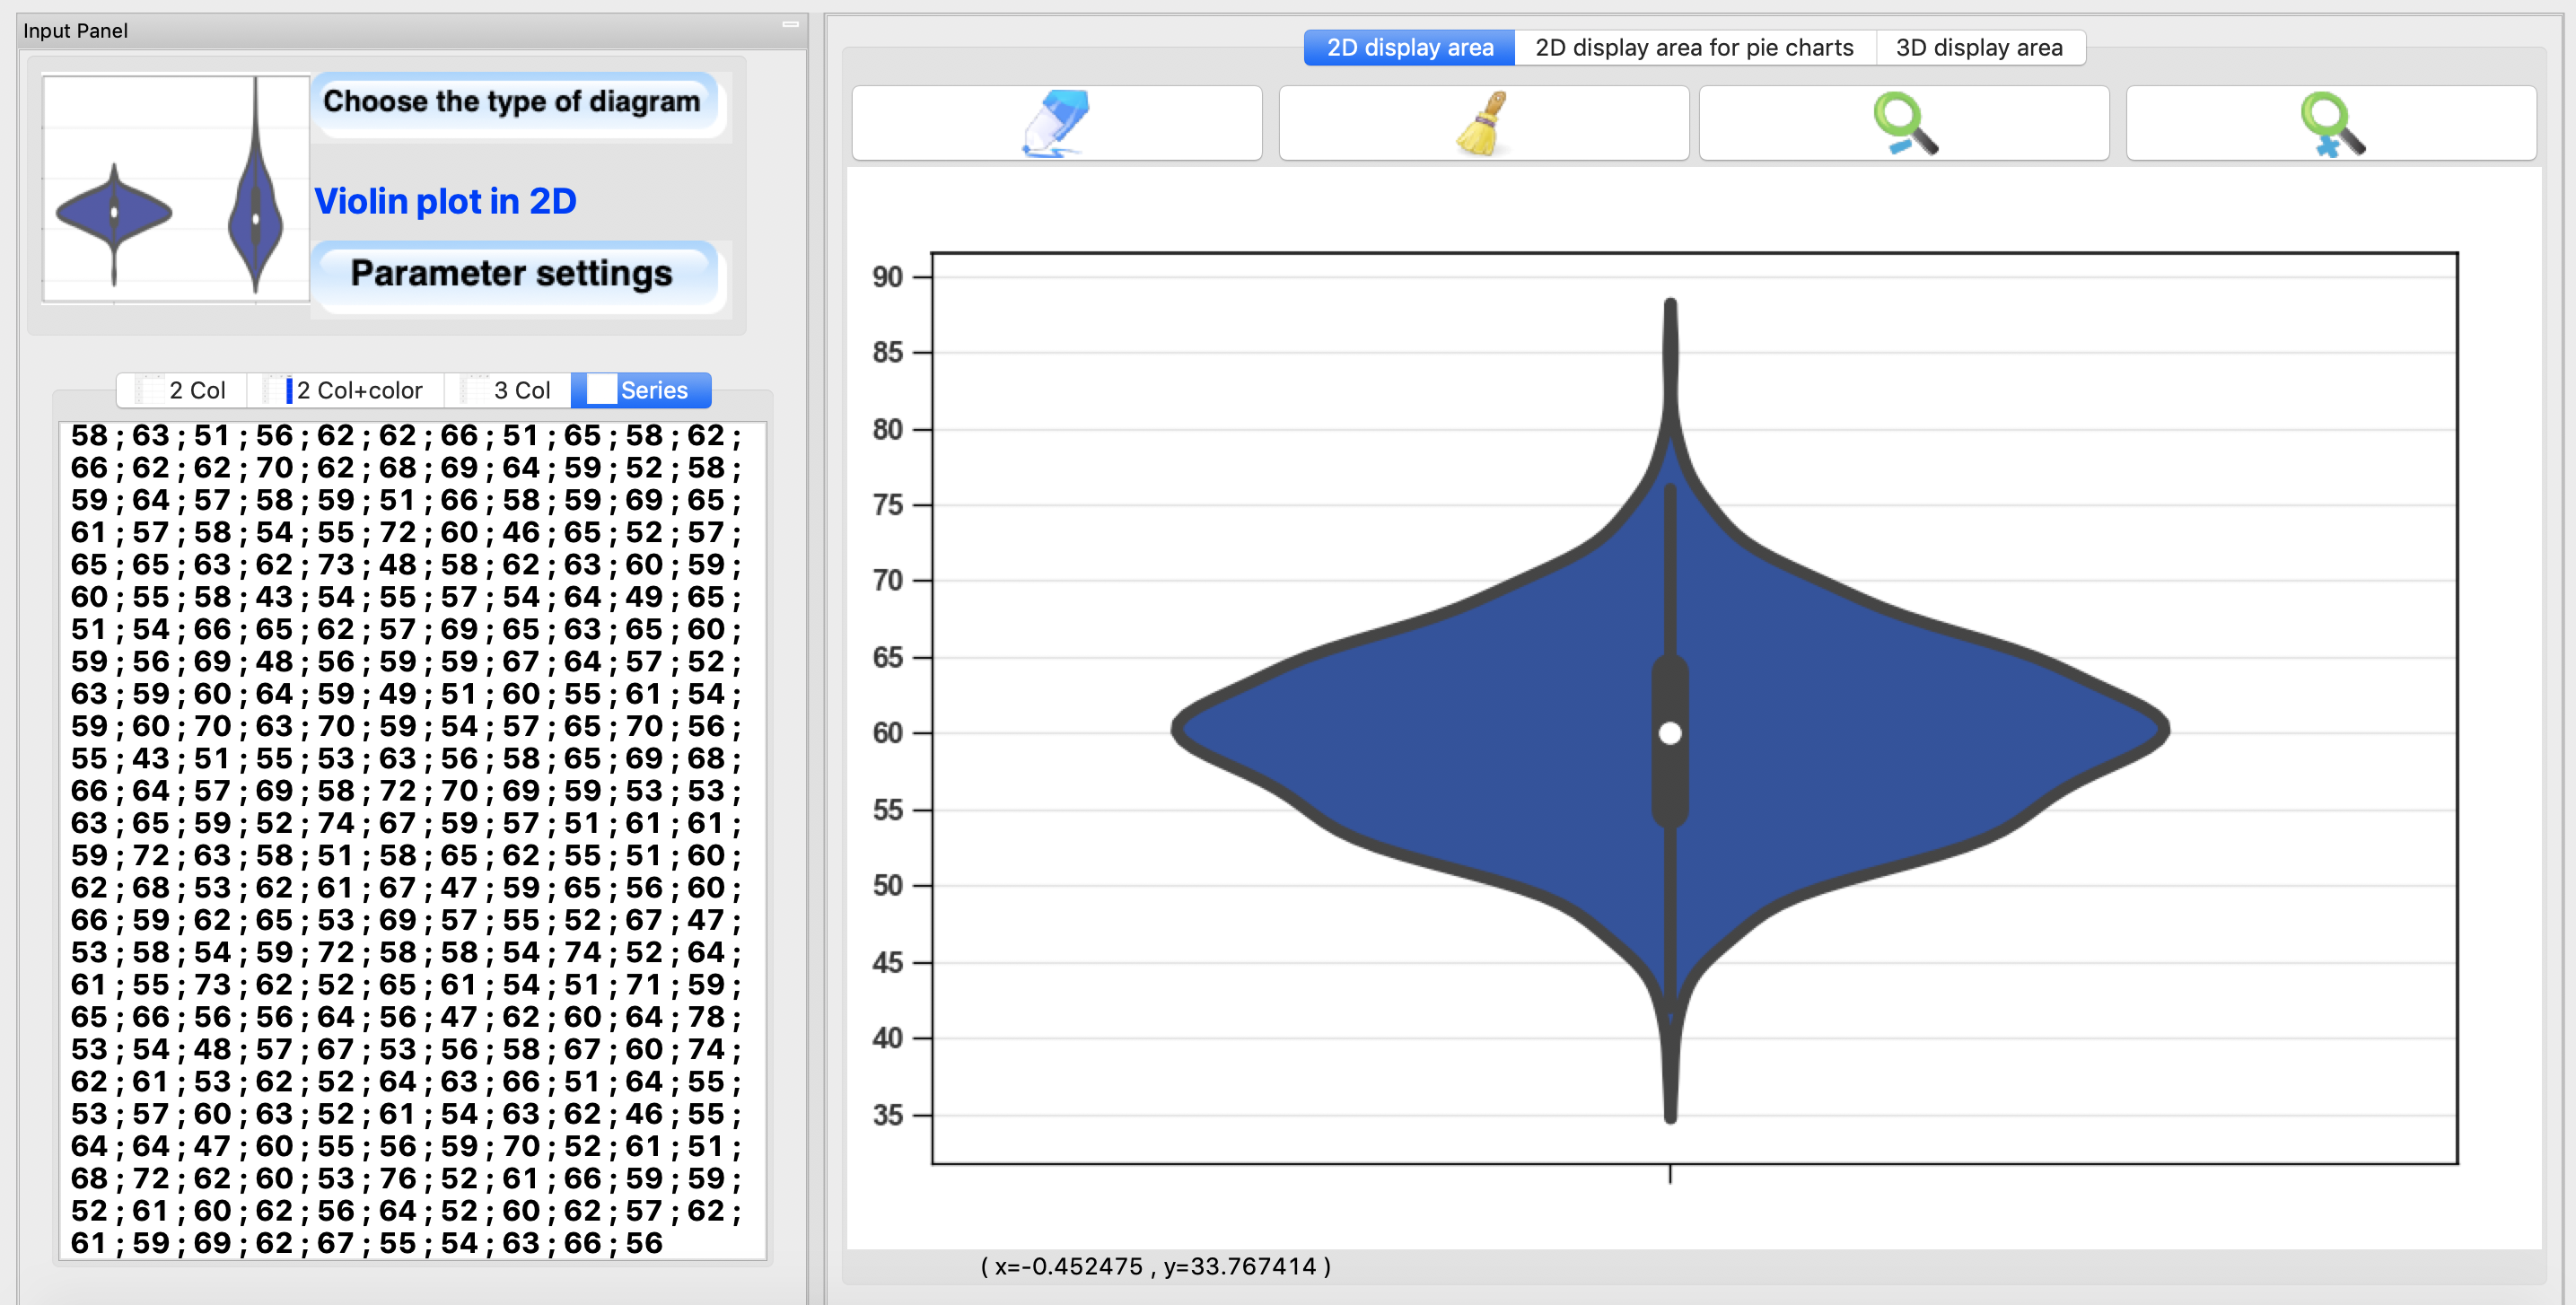
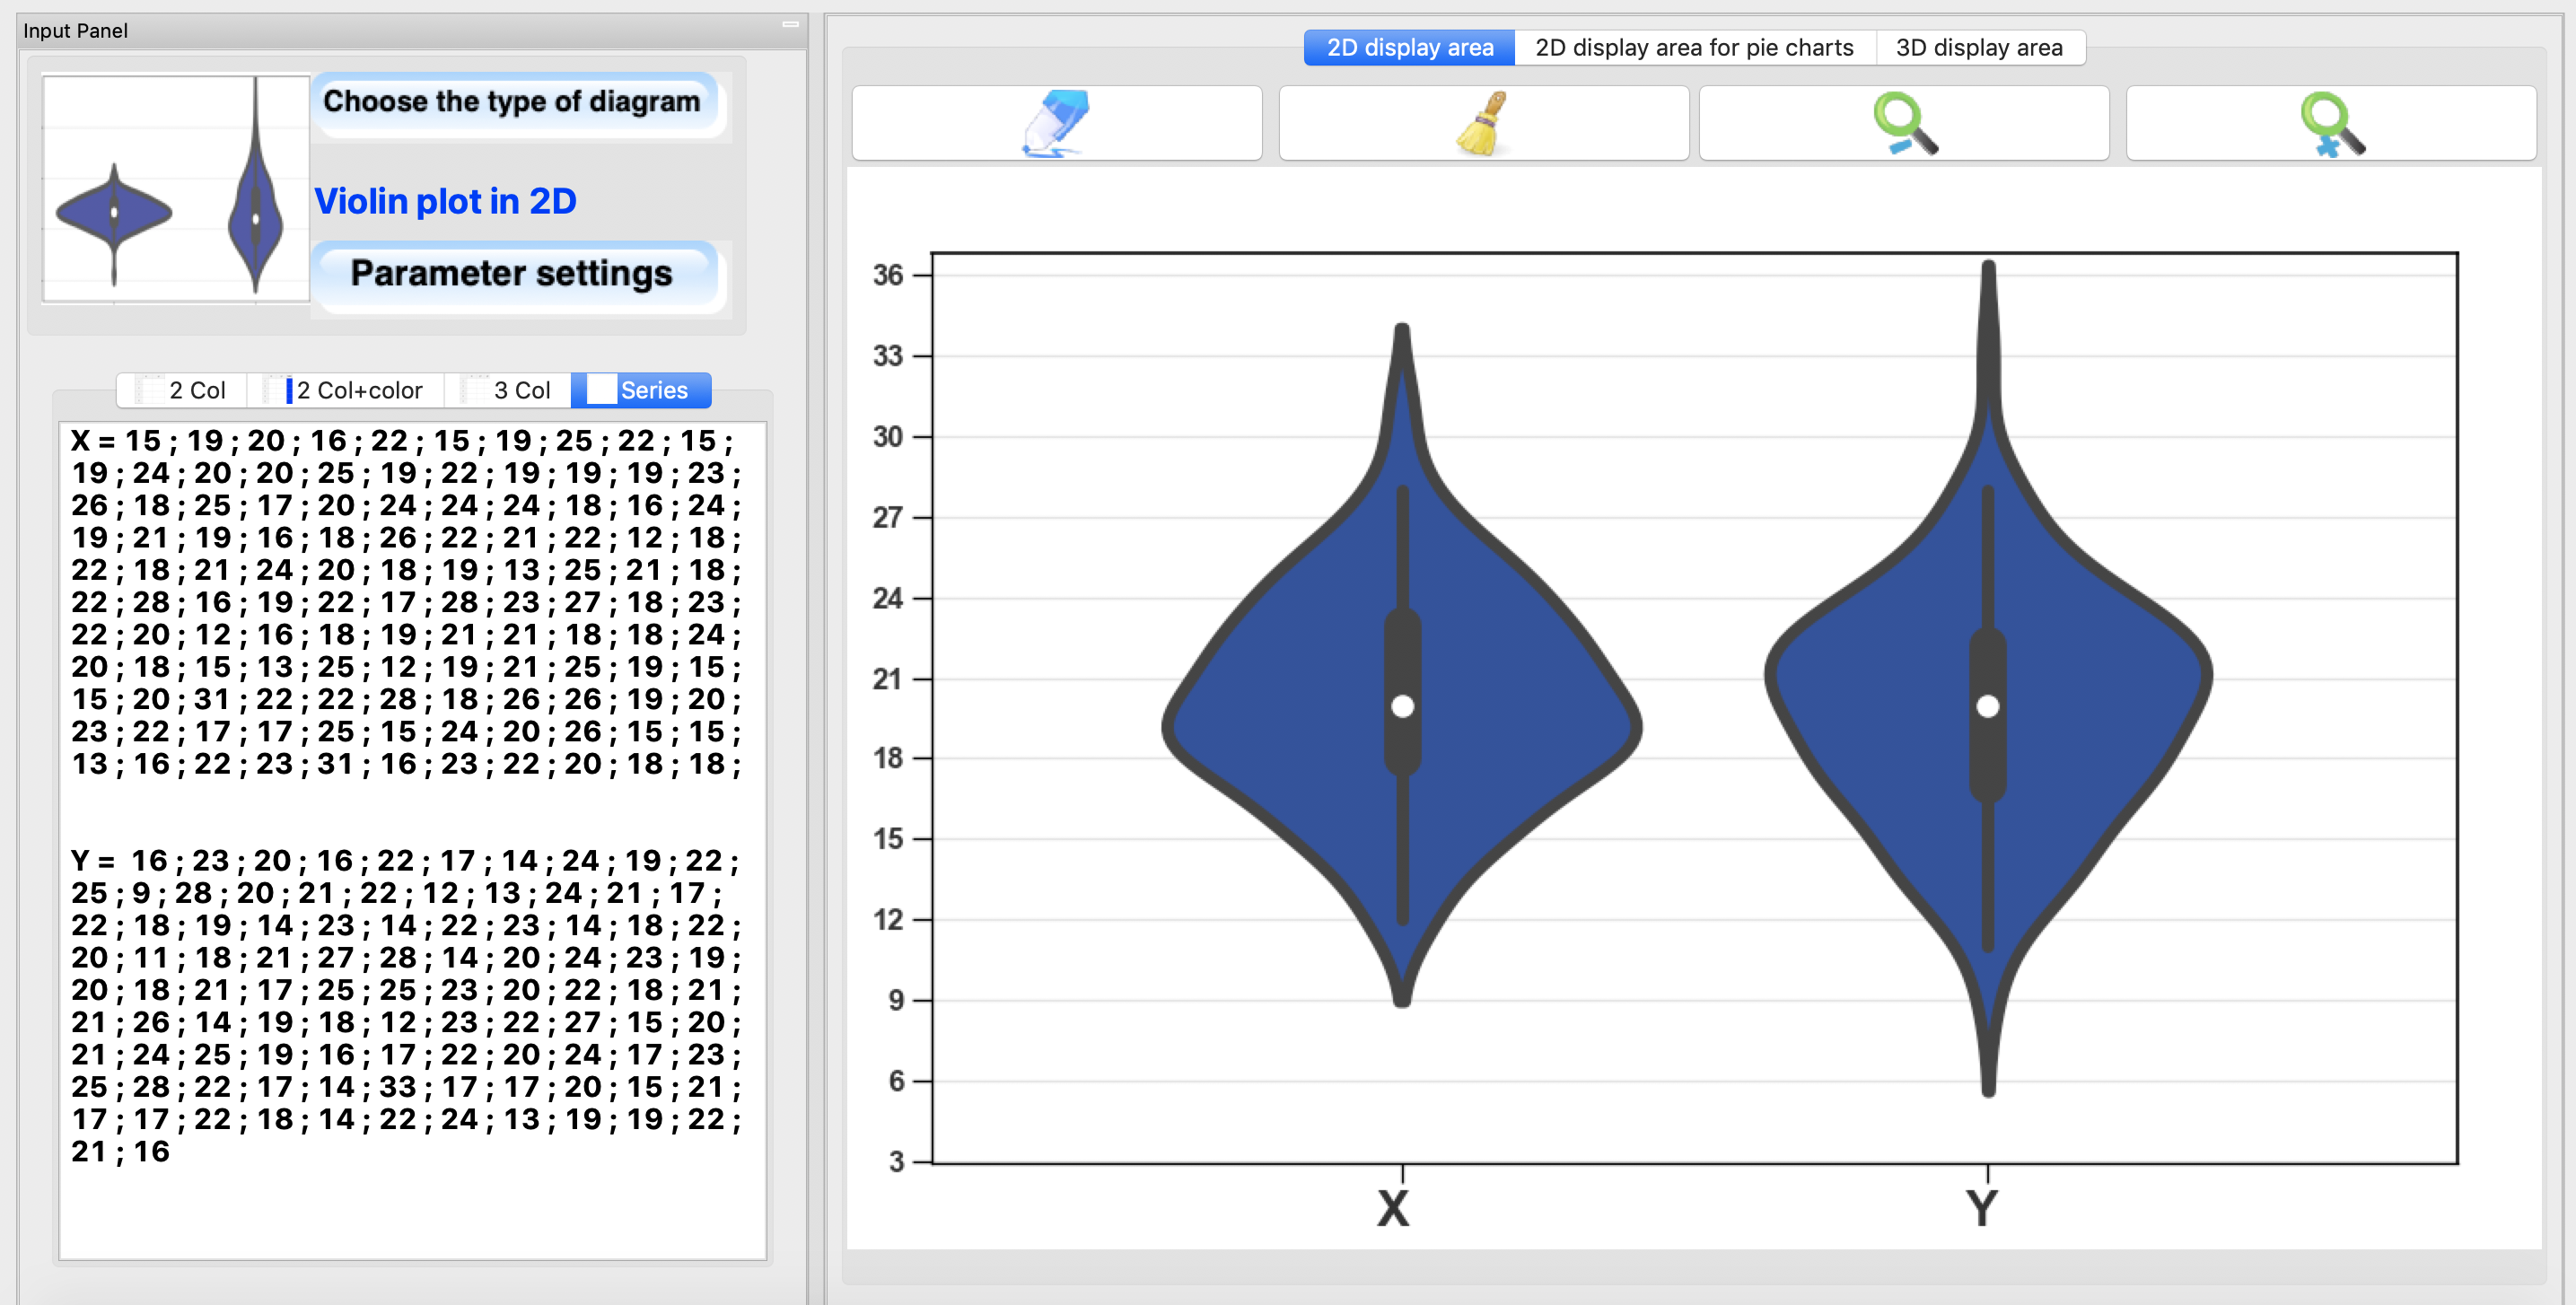
Violin plot
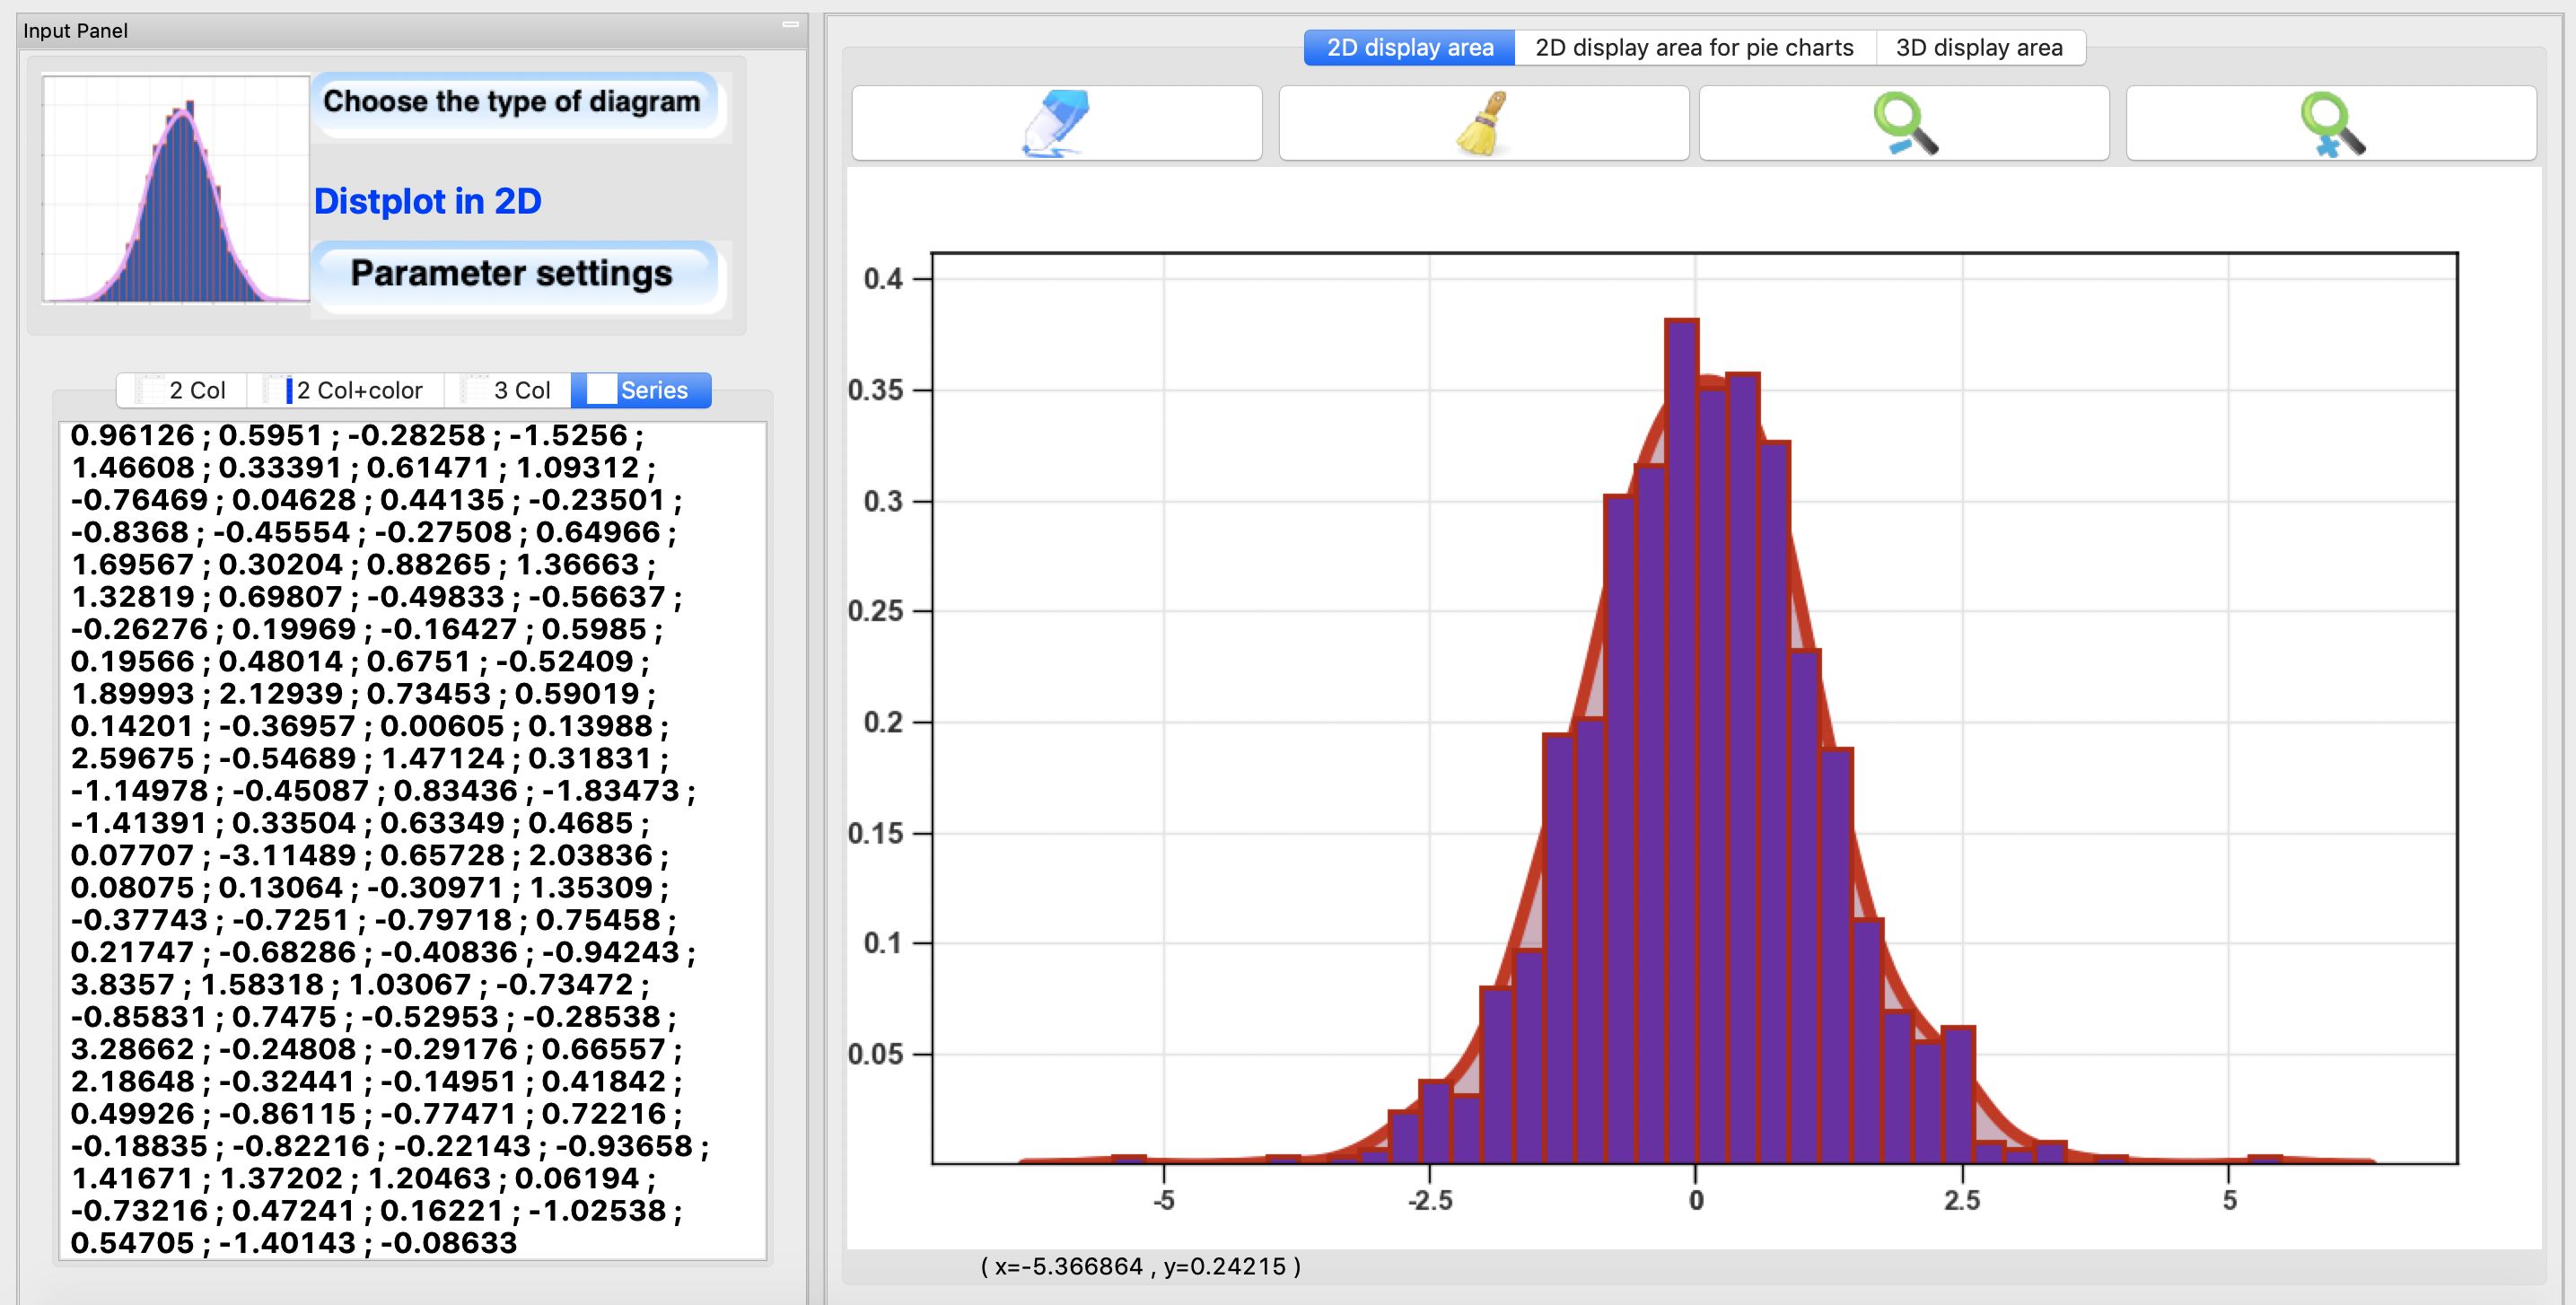
Distplot
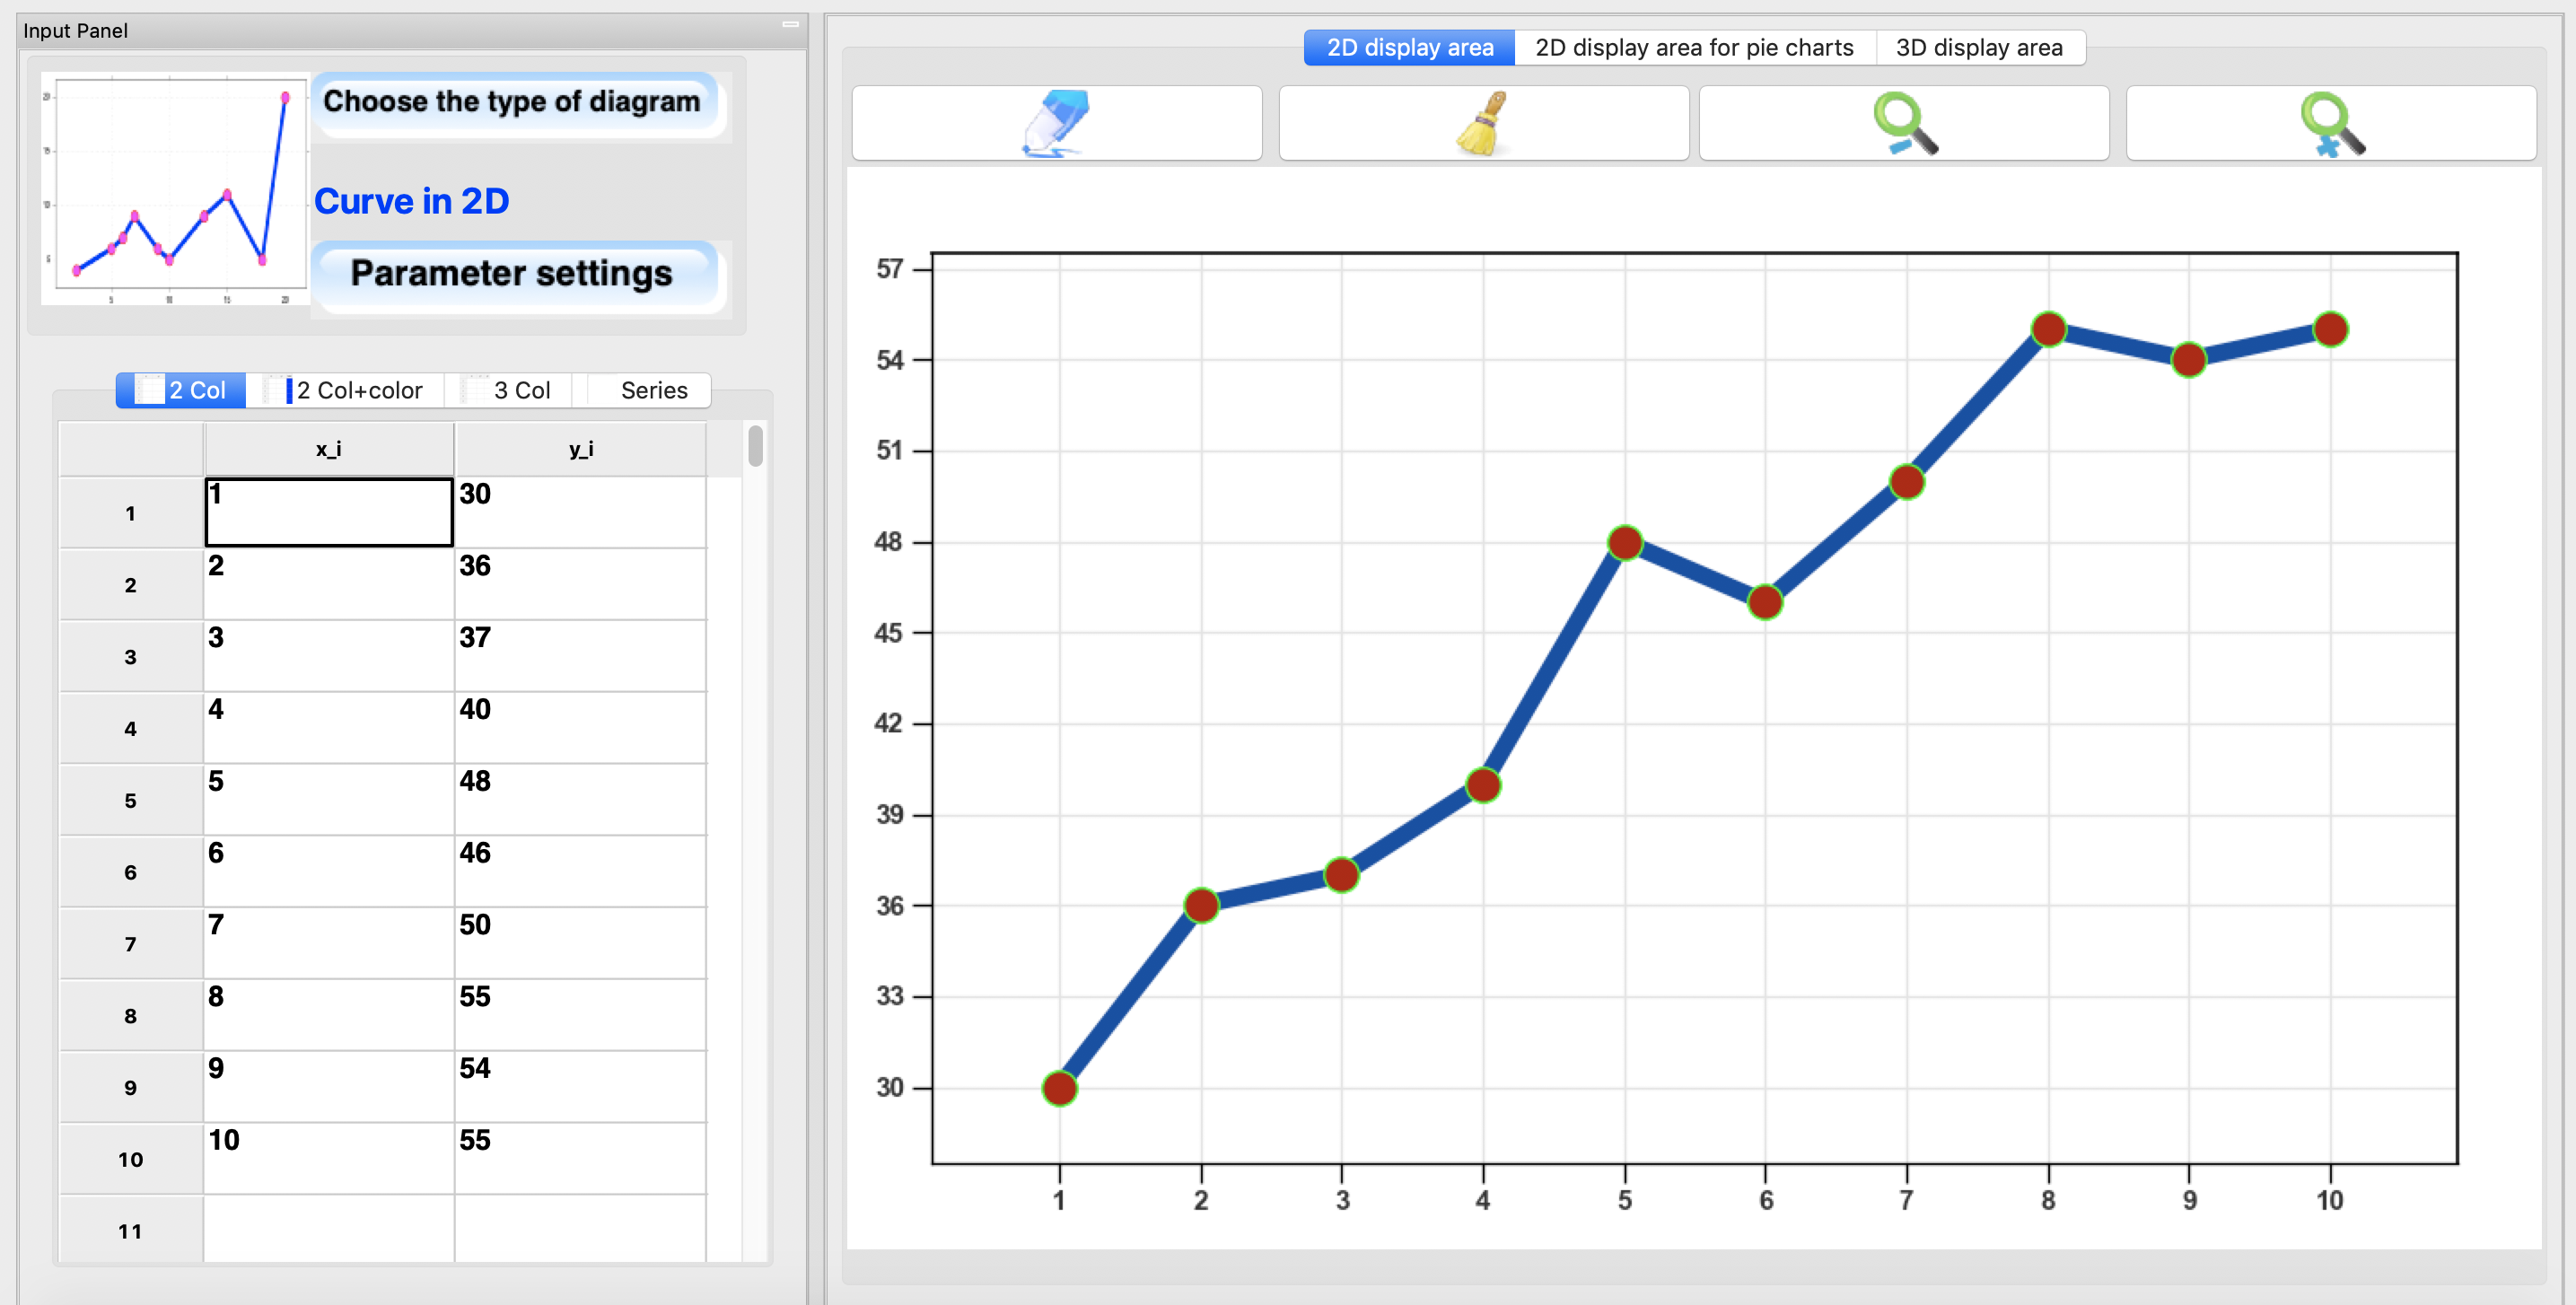
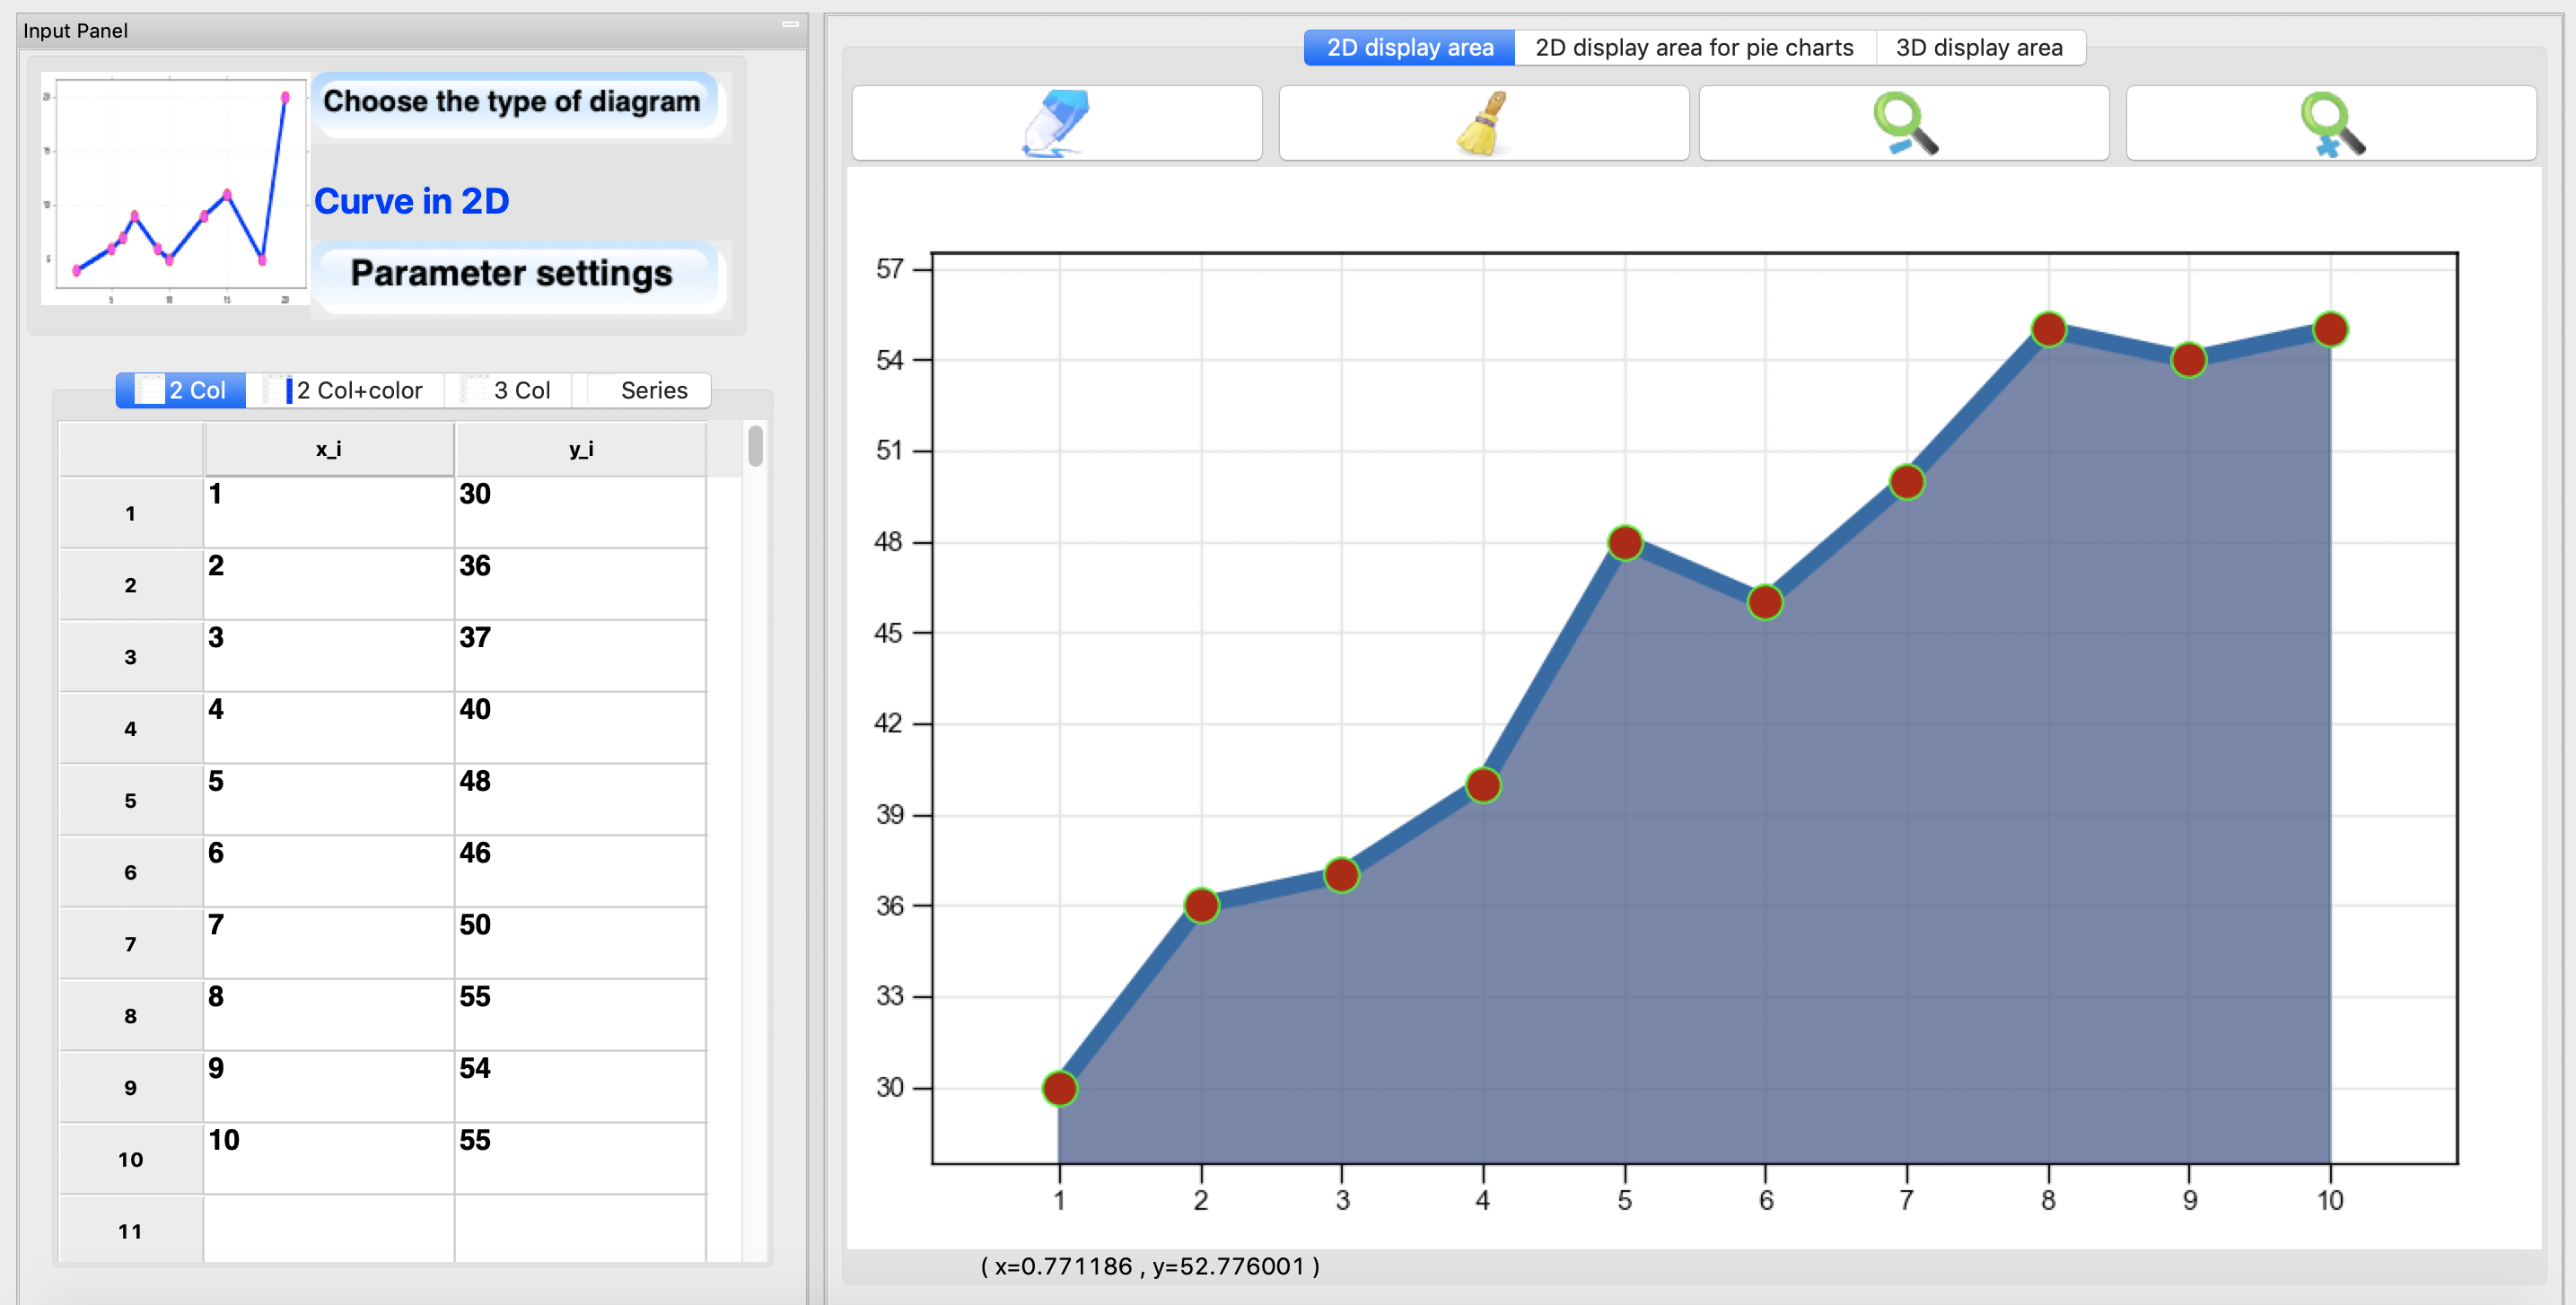
Curves
A curve
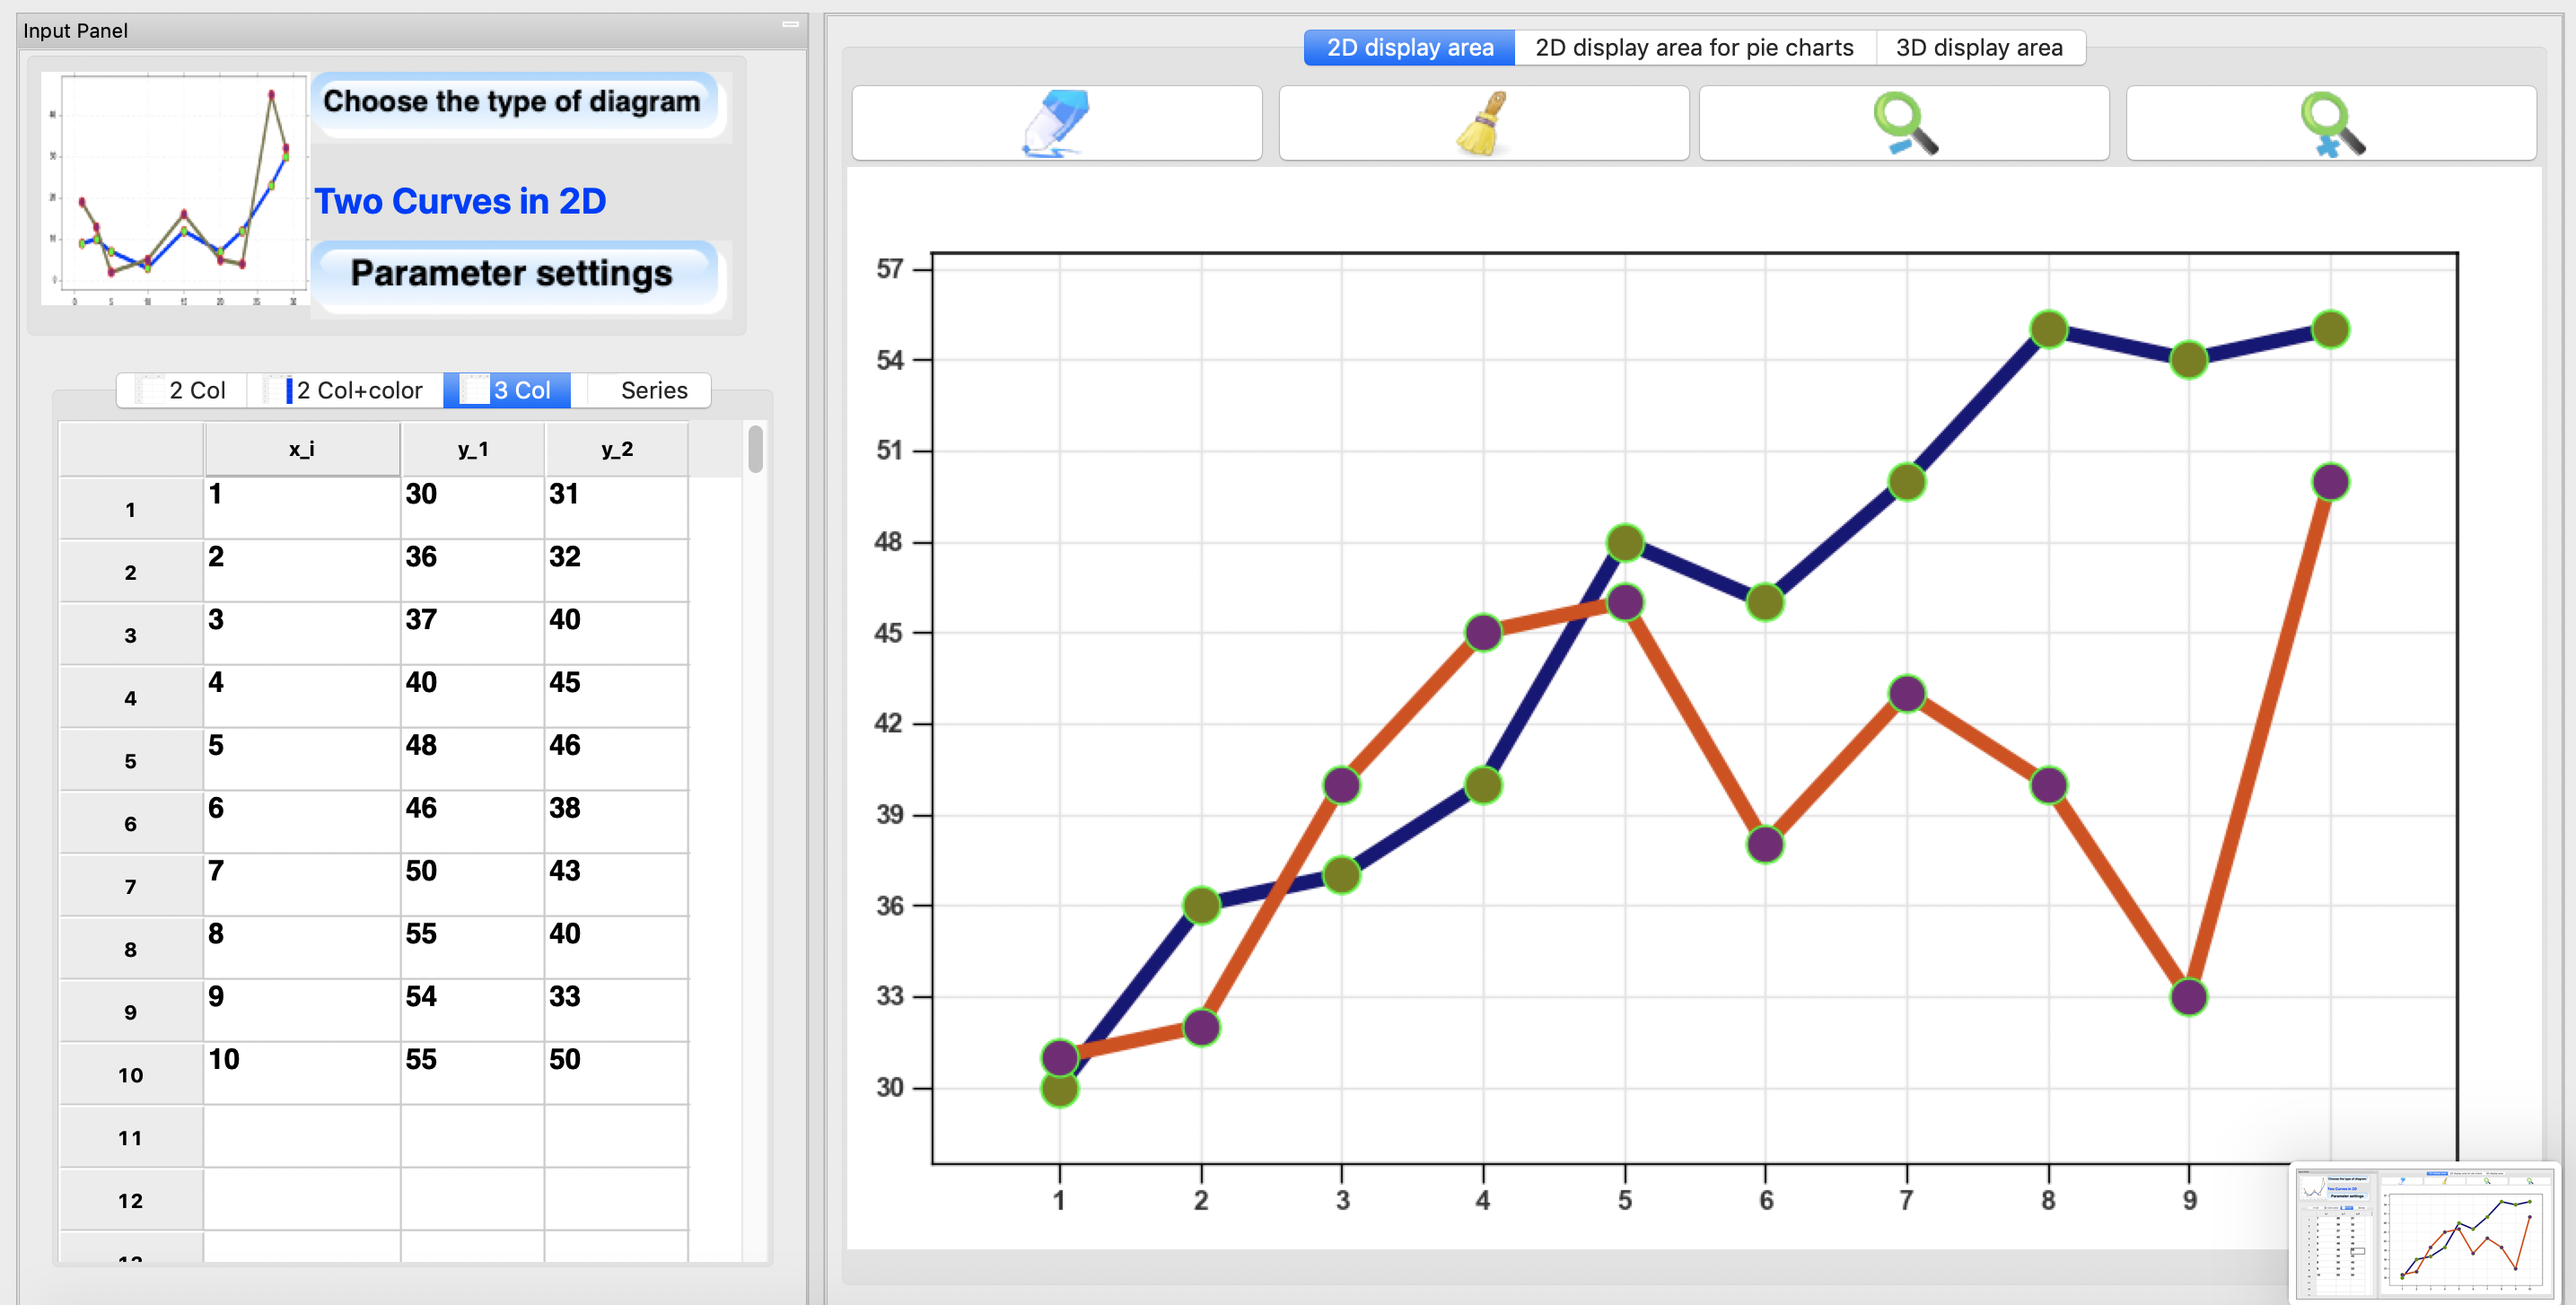
Two curves simultaneously