Bivariate descriptive statistics
For bivariate descriptive statistics, the following characteristics can be determined
the covariance
the linear correlation coefficient
the coefficient of determination
the chi-square distance
Cramer’s phi square
Tschuprow’s T
the regression line
Data entry is very simple as shown in the examples below.
Contingency table
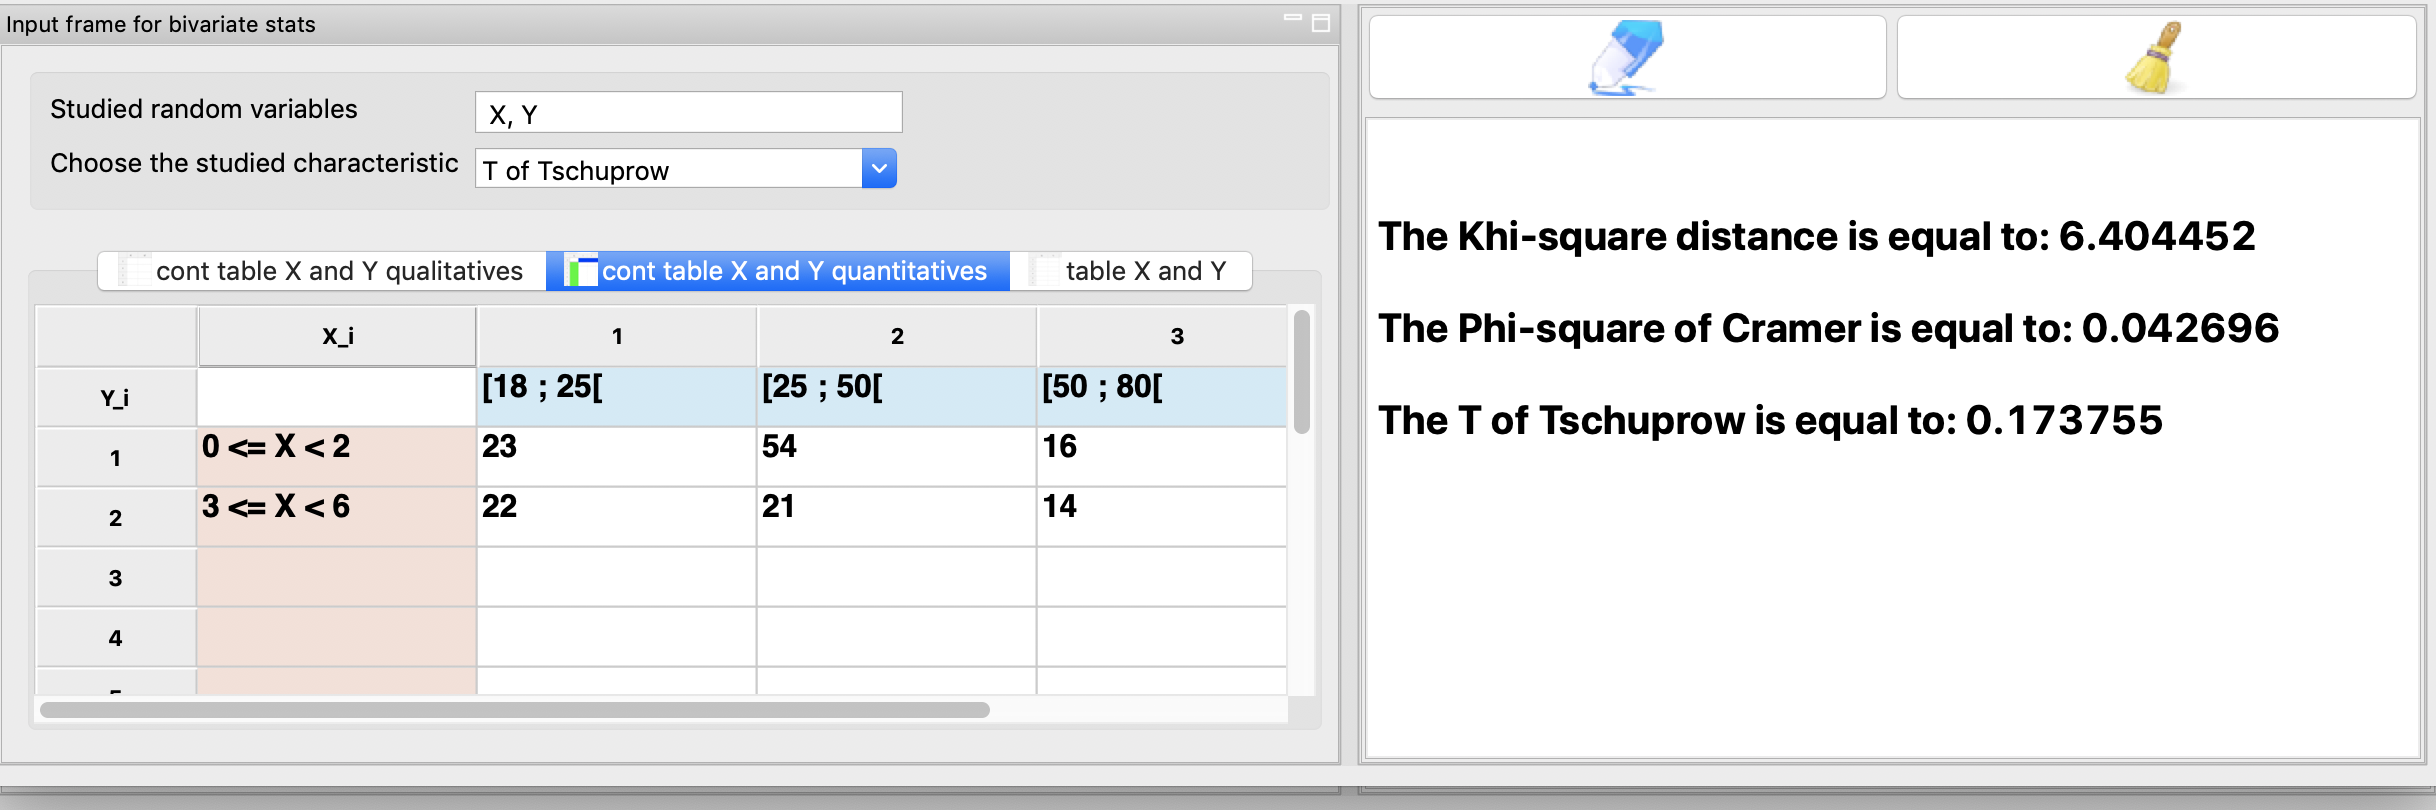
Example 1 : Contingency table with X and Y quantitative
An insurance company has carried out a sample survey from its customer file to know the distribution of the number of road accidents (X) according to the age of the insured (Y). The result of this survey is given by the following table.
Age (in years) |
|||
|---|---|---|---|
Number of accidents |
[18 ; 25[ |
[25 ; 50[ |
[50 ; 80[ |
from 0 to 2 |
23 |
54 |
16 |
from 3 to 6 |
22 |
21 |
14 |
Calculate the chi-square of contingency.
Deduce the values of Cramer’s \(\Phi^2\) and Tschuprow’s T.
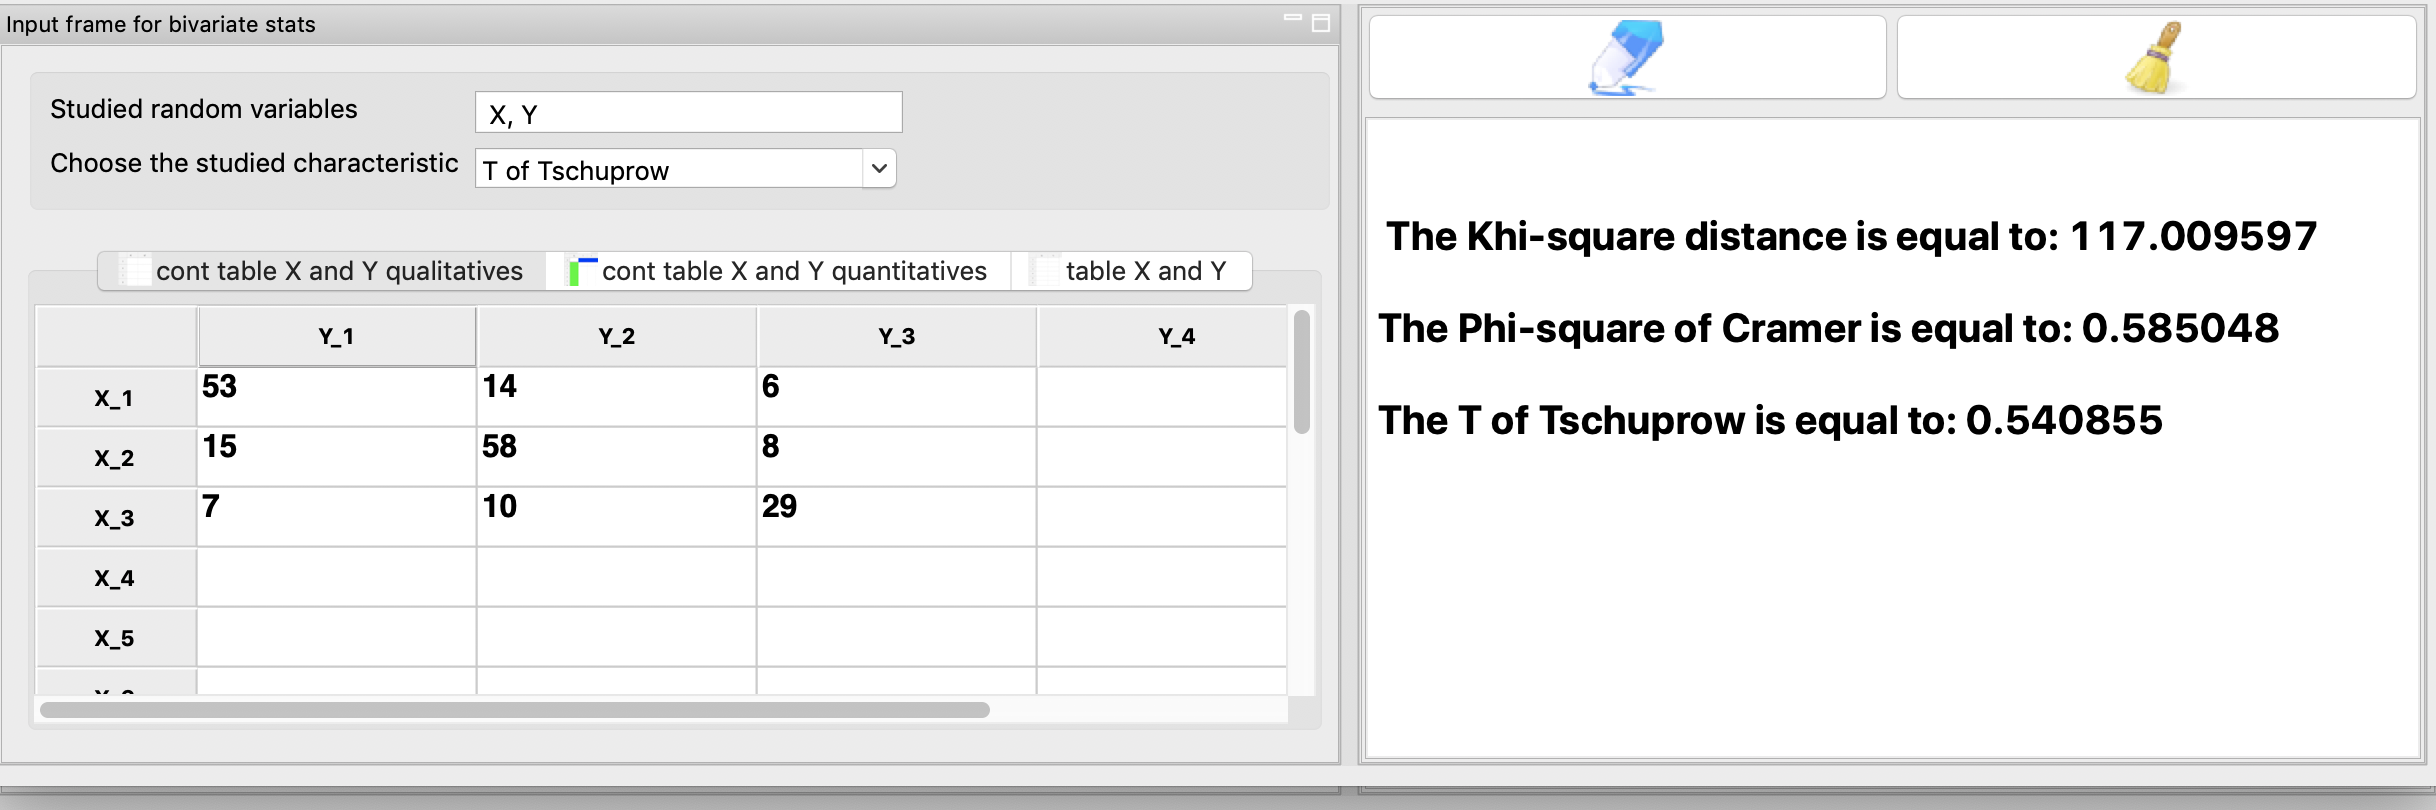
Example 2 : Contingency table with X and Y qualitatives
In a sample of 200 randomly selected households, the average propensity to save (variable Y) as a function of disposable income (variable X). For the X variable, we distinguished 3 classes (low income, intermediate income, high income). Similarly, savings rates were classified into 3 levels (low rates, intermediate rates, high rates). The results are presented in the contingency table :
\(Y_1=\) low rates |
\(Y_2=\) intermediate rates |
\(Y_3=\) high rates |
|
|---|---|---|---|
\(X_1=\) low income |
53 |
14 |
6 |
\(X_3=\) middle income |
15 |
58 |
8 |
\(X_3=\) high income |
7 |
10 |
29 |
Compute the Chi-square of contingency.
Deduce the values of Cramer’s \(\Phi^2\) and Tschuprow’s \(T\).
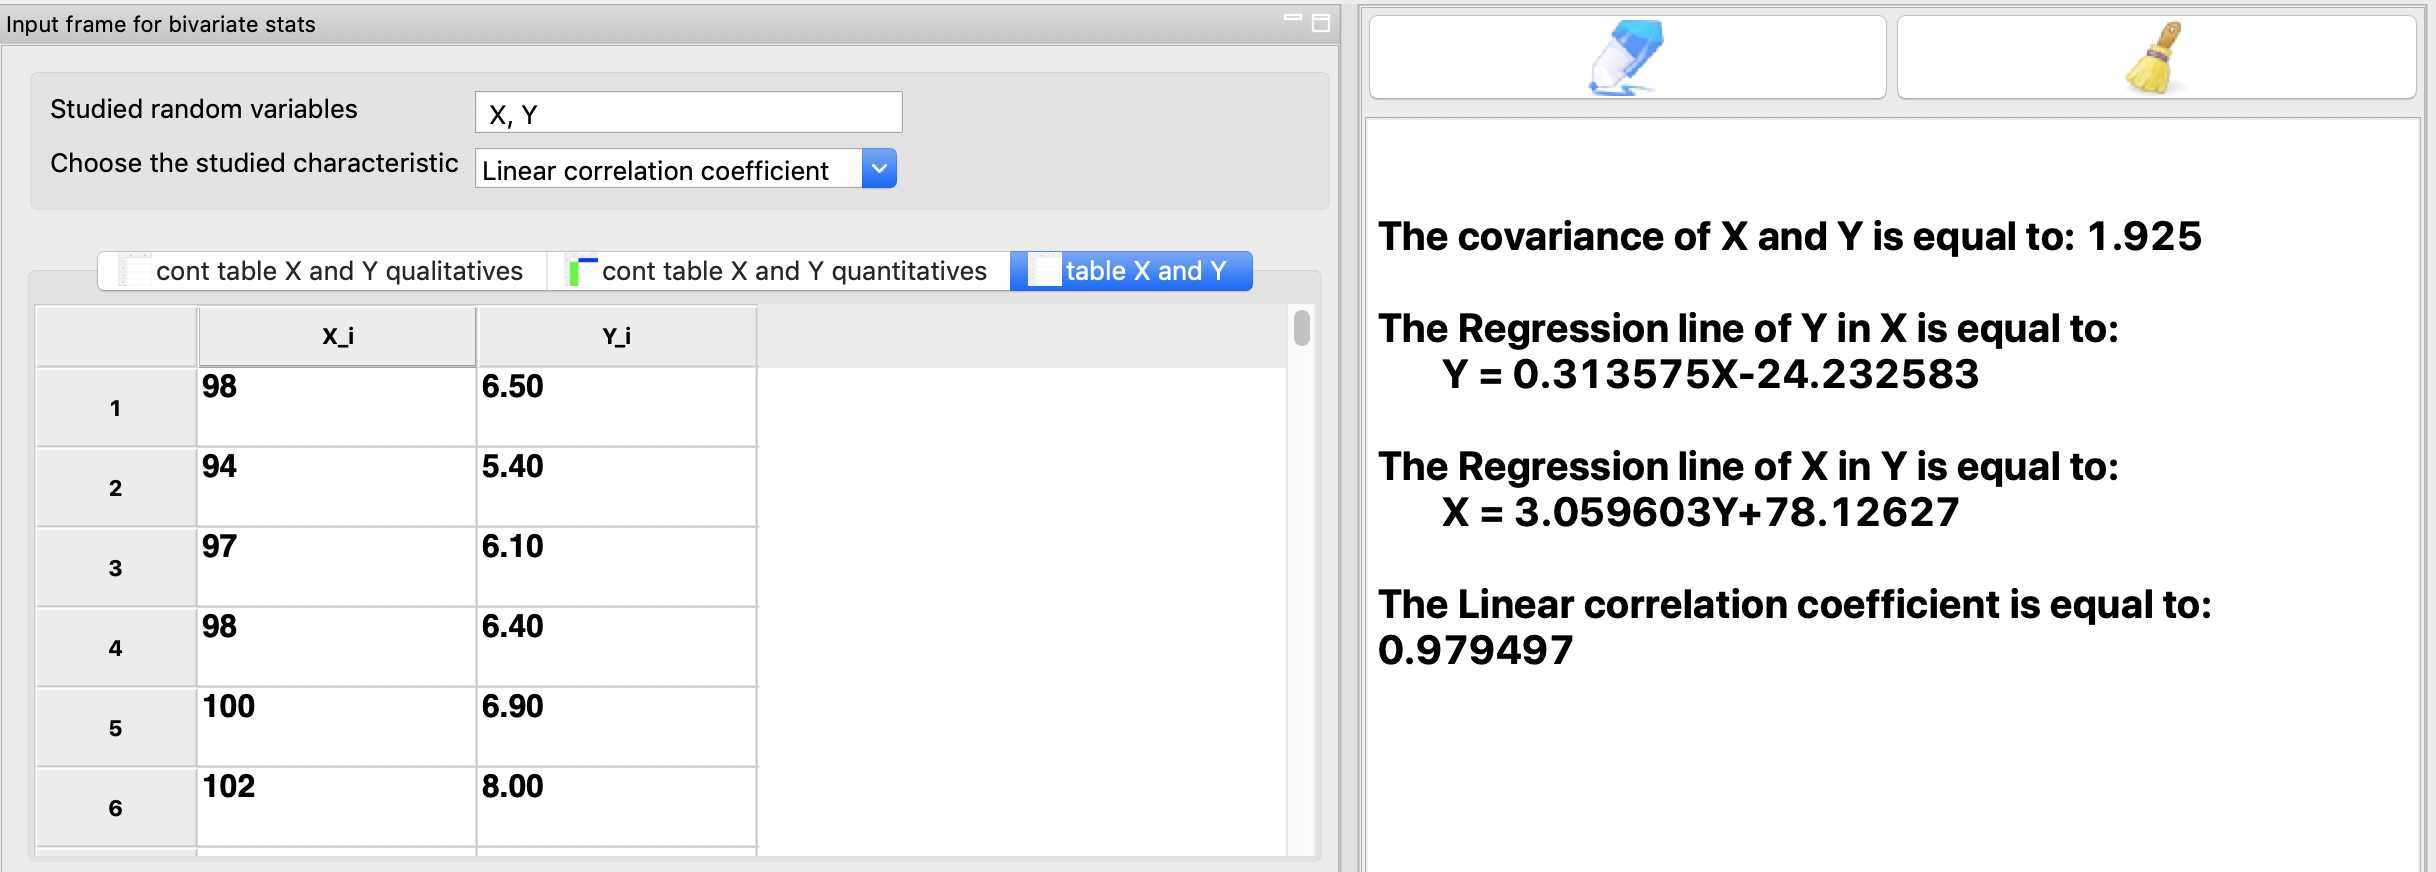
Simple table
The stock corporation R increases its capital. The stock market price of the share (X) has been raised for 6 days of the share (X) and of the subscription right (Y).
X |
98 |
94 |
97 |
98 |
100 |
102 |
|---|---|---|---|---|---|---|
Y |
6.50 |
5.40 |
6.10 |
6.40 |
6.90 |
8.00 |
Compute the covariance Cov(X, Y).
Establish the equations of the regression line of Y with respect to X.
Calculate the linear correlation coefficient between the variables X and Y.