Univariate descriptive statistics
For univariate descriptive statistics, the following characteristics can be determined
the mean
the quadratic mean
the geometric mean
the harmonic mean
the variance
the empirical variance
the moment of order alpha
the standard deviation
the empirical standard deviation
the mode (and the modal class in the case of a continuous characteristic)
the median (and the median class in the case of a continuous characteristic)
the quartiles Q1 and Q3
the absolute mean deviation
the median absolute range
the inter-quartile range
the coefficient of variation
the coefficient of skewness
Fisher’s coefficient of skewness
Yule’s coefficient of skewness
Pearson’s coefficient of skewness
Pearson’s coefficient of kurtosis
Fisher’s kurtosis coefficient
Data entry is very simple as shown in the examples below.
Discrete Variables
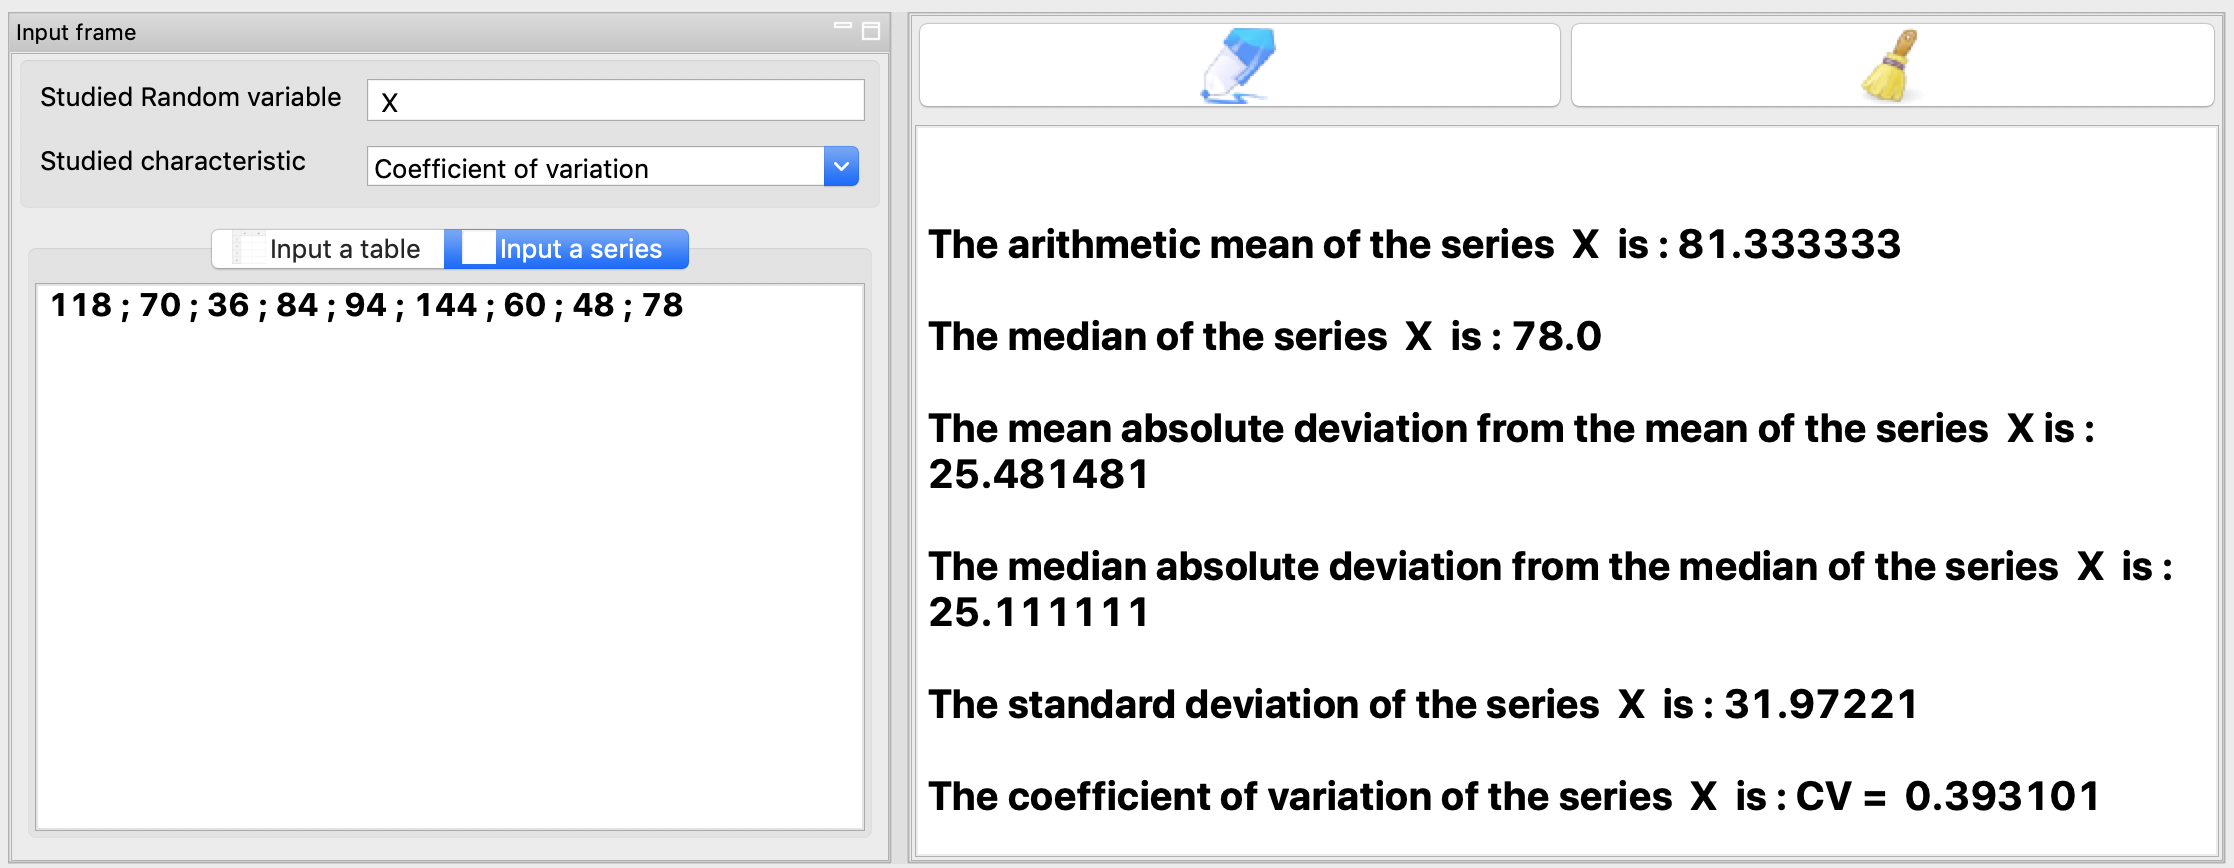
Example 1: Statistical series
The following series represents the area (in \(m^2\)) of the nine apartments in a residence: 118 ; 70 ; 36 ; 84 ; 94 ; 144 ; 60 ; 48 ; 78
Determine the arithmetic mean and median of this distribution.
Calculate the following dispersion characteristics: mean absolute deviation from the mean and median, the standard deviation and the coefficient of variation.
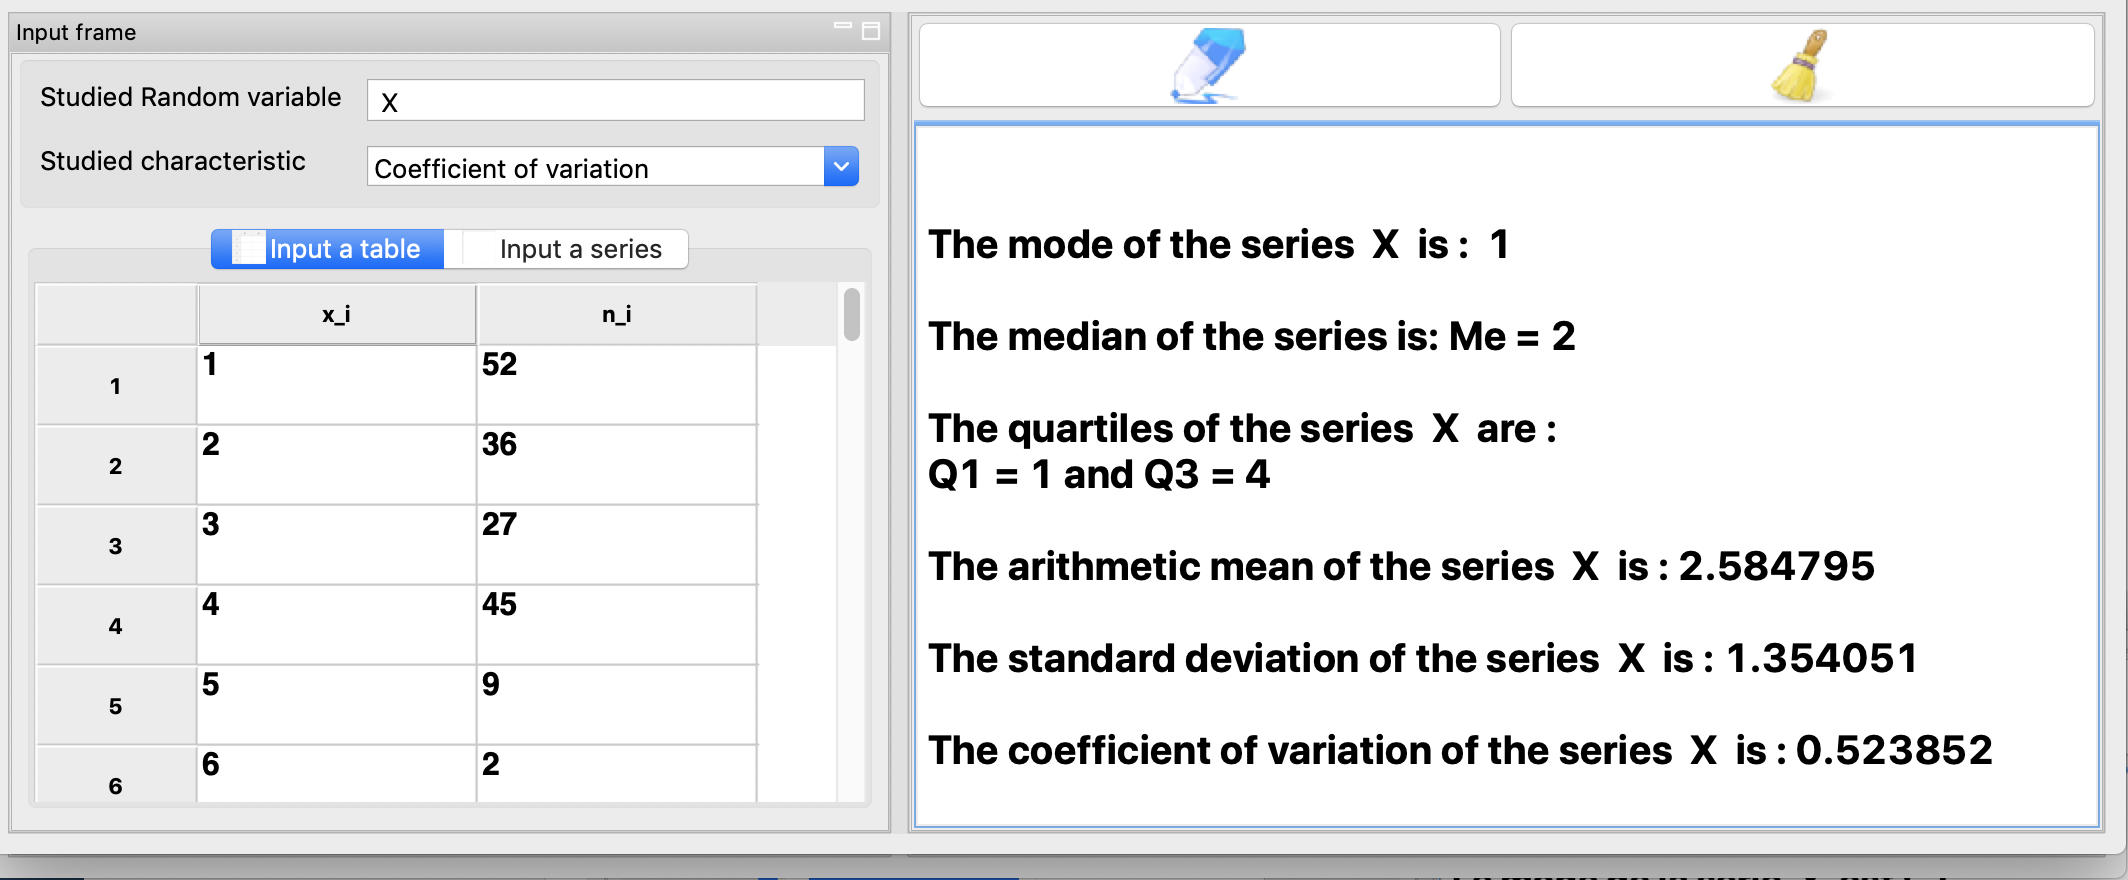
Example 2: Statistical series in table form.
In a bookstore, 180 authors have been divided according to the number of textbooks they have written.
\(x_i\) |
1 |
2 |
3 |
4 |
5 |
6 |
7 |
|---|---|---|---|---|---|---|---|
\(n_i\) |
52 |
36 |
27 |
45 |
9 |
2 |
9 |
Determine the mode, median and quartiles \(Q_1\) and \(Q_3\).
Calculate the arithmetic mean, standard deviation and coefficient of variation of this series.
Continuous Variables
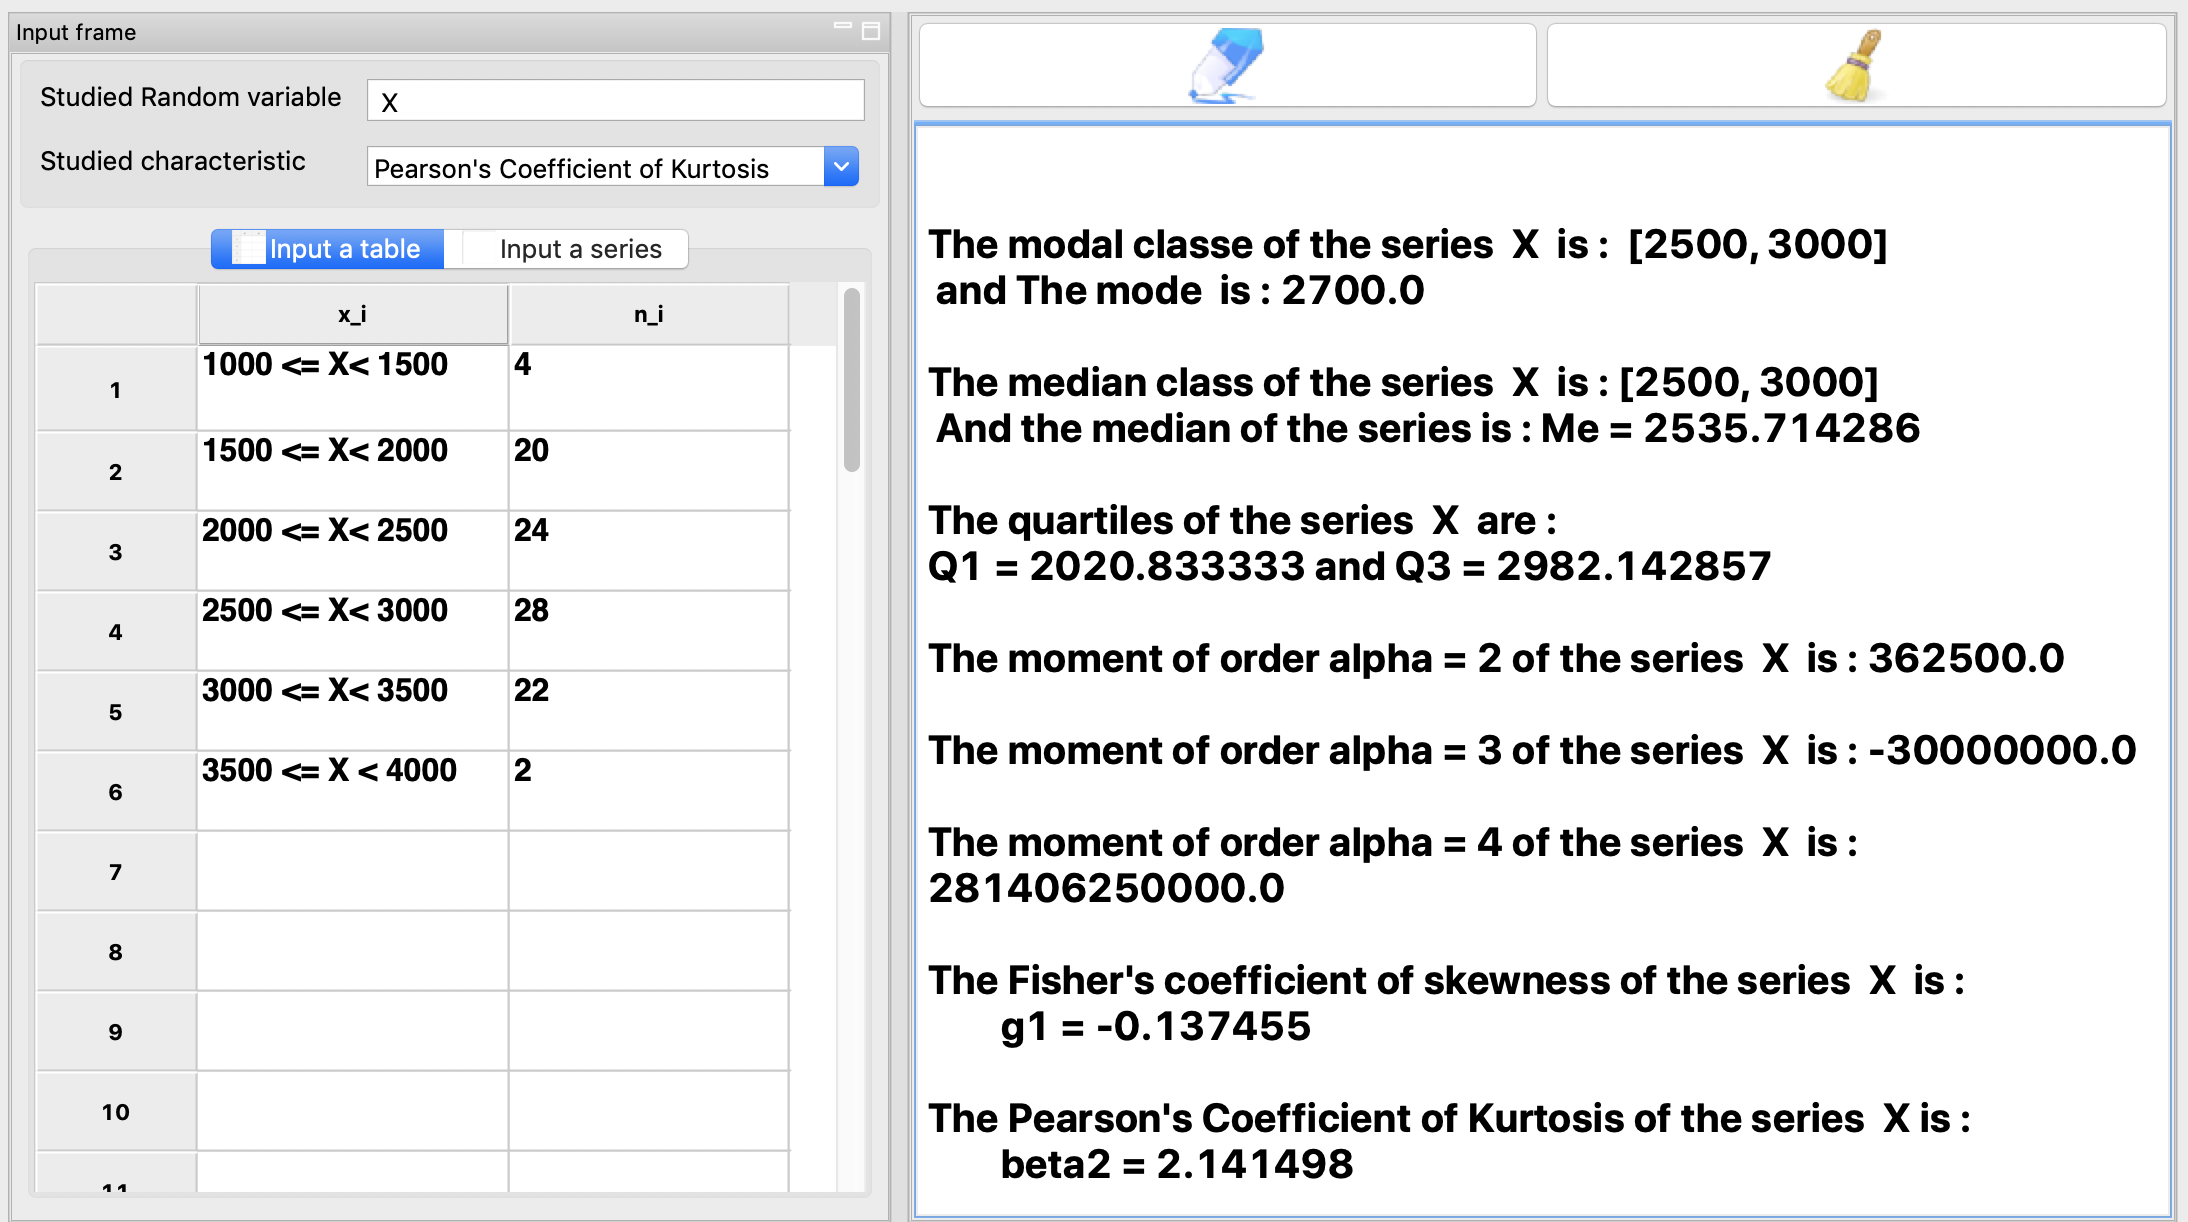
Example 3: Data grouped in classes of equal magnitude
The table below gives the distribution of the number of orders as a function of the amount of orders \(X\), for the last six months of GIE LIGGEEY.
\(X\) |
\(1000 \leq X<1500\) |
\(1500 \leq X<2000\) |
\(2000 \leq X<2500\) |
\(2500 \leq X<3000\) |
\(3000 \leq X<3500\) |
\(3500 \leq X<4000\) |
|---|---|---|---|---|---|---|
Values |
\(\ \ \ \ \ \ \ \ \ 4\ \ \ \ \ \ \ \ \) |
\(\ \ \ \ \ \ \ \ \ 20\ \ \ \ \ \ \ \ \) |
\(\ \ \ \ \ \ \ \ \ 24\ \ \ \ \ \ \ \ \) |
\(\ \ \ \ \ \ \ \ \ 28\ \ \ \ \ \ \ \ \) |
\(\ \ \ \ \ \ \ \ \ 22\ \ \ \ \ \ \ \ \) |
\(\ \ \ \ \ \ \ \ \ 2\ \ \ \ \ \ \ \ \) |
Determine the modal class, mode, median and quartiles \(Q_1\) and \(Q_3\).
Compute the centered moments of order \(2, 3\) and \(4\) of this distribution.
Calculate the Fisher skewness coefficient and the Pearson kurtosis coefficient.
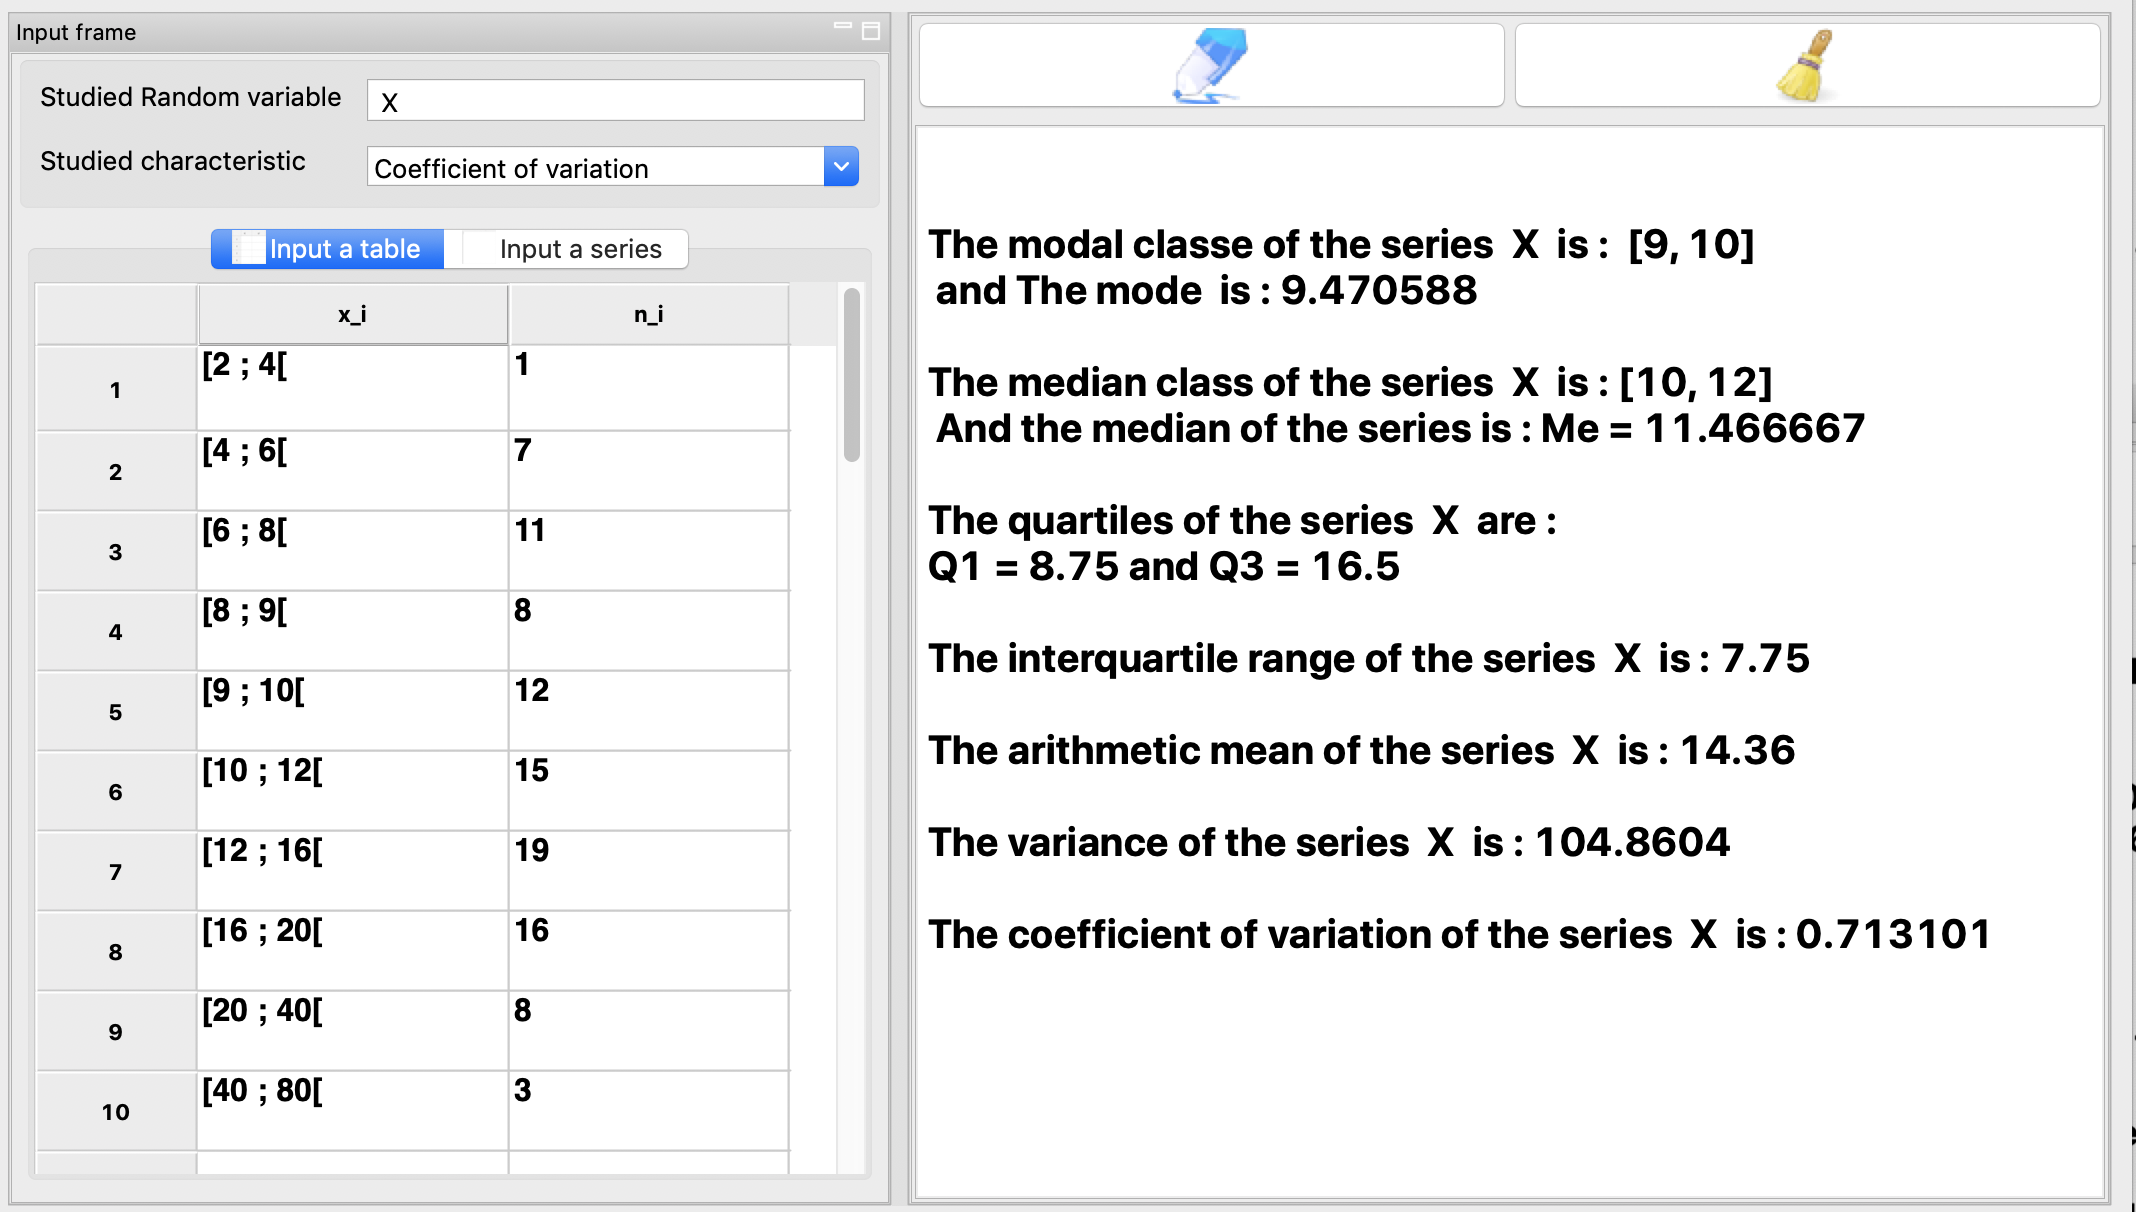
Example 4: Data grouped into classes of unequal magnitude
The table below provides the percentage distribution of a municipality’s inhabitants according to the annual amount of their local taxes (in thousands of dollars)nof their local taxes (in thousands of francs).
Classes |
[2 ; 4[ |
[4 ; 6[ |
[8 ; 9[ |
[9 ; 10[ |
[10 ; 12[ |
[12 ; 16[ |
[16 ; 20[ |
[20 ; 40[ |
[40 ; 60[ |
[60 ; 80[ |
|---|---|---|---|---|---|---|---|---|---|---|
Values |
1 |
7 |
11 |
8 |
12 |
15 |
19 |
16 |
8 |
3 |
Determine the modal class, mode, median and quartiles \(Q_1\) and \(Q_3\).
Calculate the arithmetic mean of this series, the interquartile range, the variance and the coefficient of variation.